7.2. Sample Crosstab Report
To create a crosstab report, select Crosstab band orientation on the Report structure tab of the report editor. This orientation automatically adds three datasets to the band:
-
<band_name>_dynamic_header – the data from this dataset is copied to the right like a vertical band with table columns header. -
<band_name>_master_data – the data from this dataset is copied downwards like a horizontal band with table rows header. -
<band_name>– the dataset named the same as the band, it belongs to. It is the main content band that will fulfill the matrix cells.
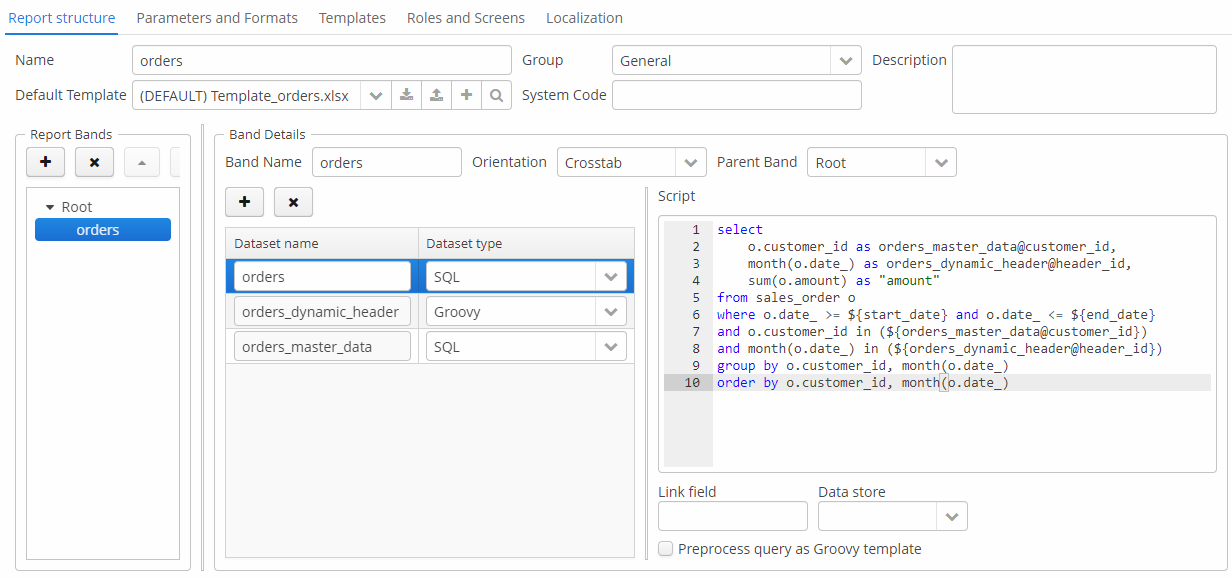
For example, a crosstab report for the Order entity of the Sales sample application has the following structure:
-
Report data structure
Let us consider report bands.
-
Here, the
orders_dynamic_headerdataset will return the list of months names:orders_dynamic_header datasetimport java.text.DateFormatSymbols List result = new ArrayList() DateFormatSymbols dateFormatSymbols = DateFormatSymbols.getInstance(Locale.ENGLISH) for (i in 0..dateFormatSymbols.months.length - 1) { result.add(["header_id" : i + 1, "month_name" : dateFormatSymbols.months[i]]) } return result -
The
orders_master_datadataset returns names and identifiers of the customers selected by the user as an external report parameter:orders_master_data datasetselect name as name, id as customer_id from SALES_CUSTOMER where id in (${selected_customers}) -
The
ordersdataset will provide data for the matrix cells, which is the order amounts sum for the particular month and customer. It takesorders_master_data@customer_id(the customer id) as the vertical coordinate of the cell, andorders_dynamic_header@header_id(the month name) as the horizontal coordinate, and fills the matrix cell with theamountvalue.In the example below the report has two more external parameters: the
start_dateand theend_datethat define the range of order dates. It would be a good idea to set up cross-parameter validation to make sure the range makes sense.orders datasetselect o.customer_id as orders_master_data@customer_id, month(o.date_) as orders_dynamic_header@header_id, sum(o.amount) as "amount" from sales_order o where o.date_ >= ${start_date} and o.date_ <= ${end_date} and o.customer_id in (${orders_master_data@customer_id}) and month(o.date_) in (${orders_dynamic_header@header_id}) group by o.customer_id, month(o.date_) order by o.customer_id, month(o.date_)
-
-
Report parameters.
The Parameters and Formats tab contains three declared report external parameters –
selected_customers,start_date,end_date: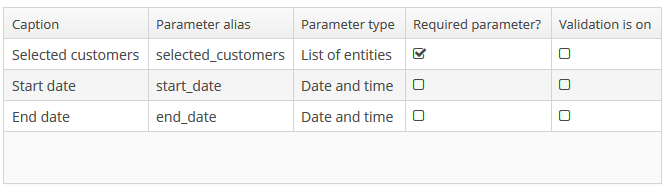 Figure 66. Report parameters
When running the report, the user will have to enter these parameters. The customer selection will be performed via the
sales_Customer.browsescreen, available in the application. -
Report template.
Then you can create a report template using Microsoft Office or LibreOffice.
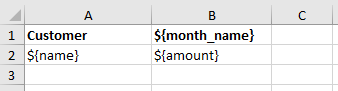
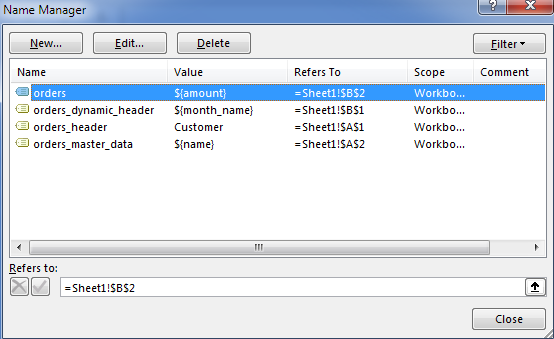
The report template should contain named regions for all three datasets of the crosstab band and, additionally, the named region for the column header:
<band_name>_header. In our case it isorders_header.
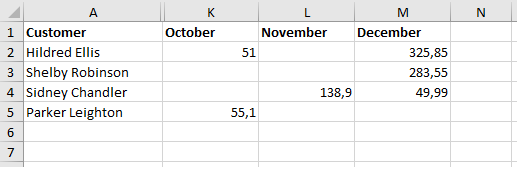
Below is an example of a template which outputs the list of Customers vertically and Orders made by each customer horizontally grouped by the months the orders were placed.
As a result, the report is extended both vertically and horizontally and aggregates the order amounts for each customer and each month:
If you want to add totals for the report, you should do it in separate bands with their own datasets.