4.2.9. Table Formatter
When you select table output in the wizard, the system automatically creates a template. When running the report, data will be displayed on a special screen of the application.
You can also create a template manually for an existing report. To do this, select Table as the output type in the report template editor.
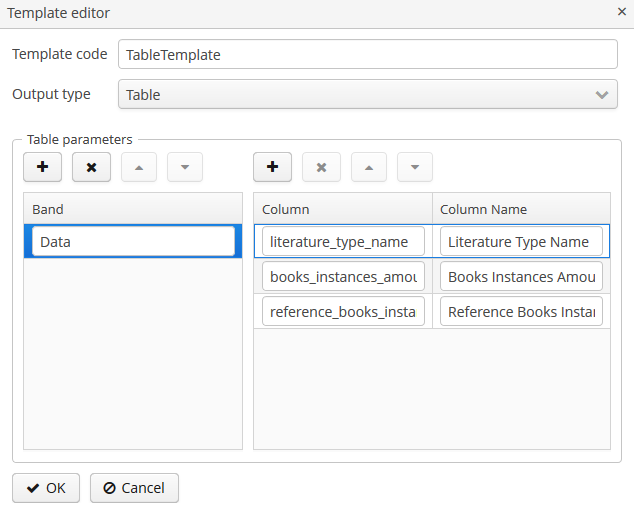
In the Band column, add the names of the bands that you want to display in the resulting table. For each band, set a key-value map, where the key is the name of a dataset property, and the value is its localized caption.
The report generator will get the band data and draw a sortable table for each band from the first level of the hierarchy.
The table displays columns for all properties for SQL, JPQL datasets. If the Entity/List of Entities dataset is used, the table will display only the columns for selected attributes.
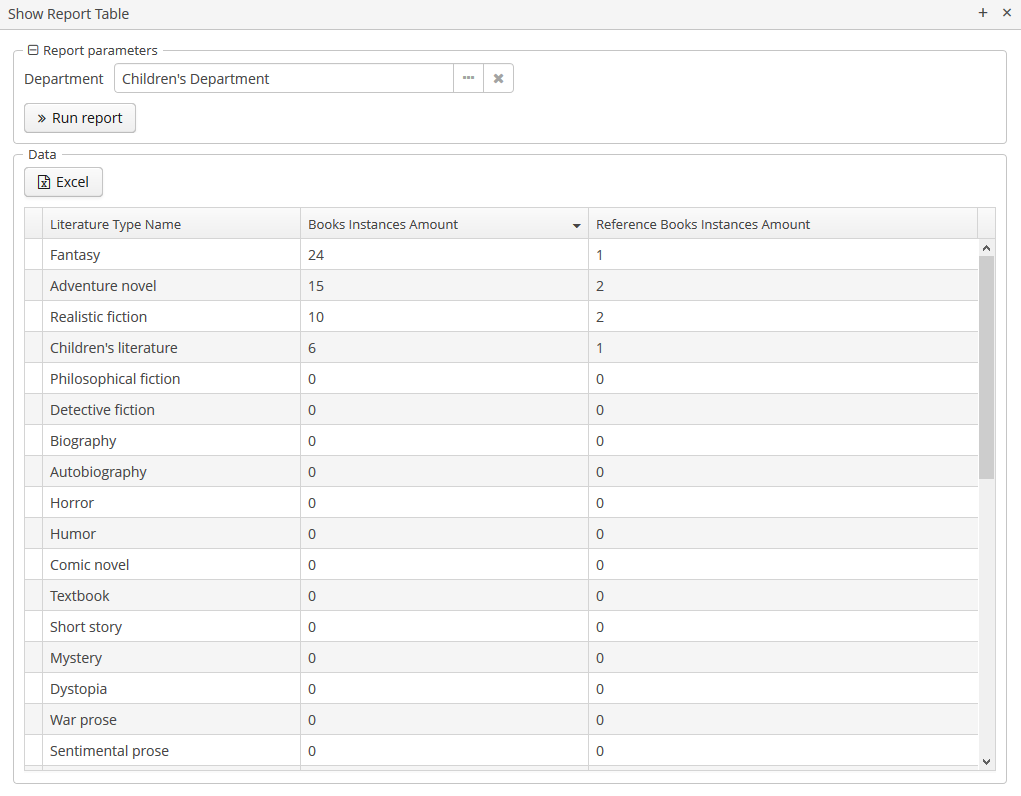
The resulting table is displayed in the Reports > Show Report Table screen of your web application. The Excel button enables you to download the displayed table as an Excel file.