1.6.7. StockChartGroup
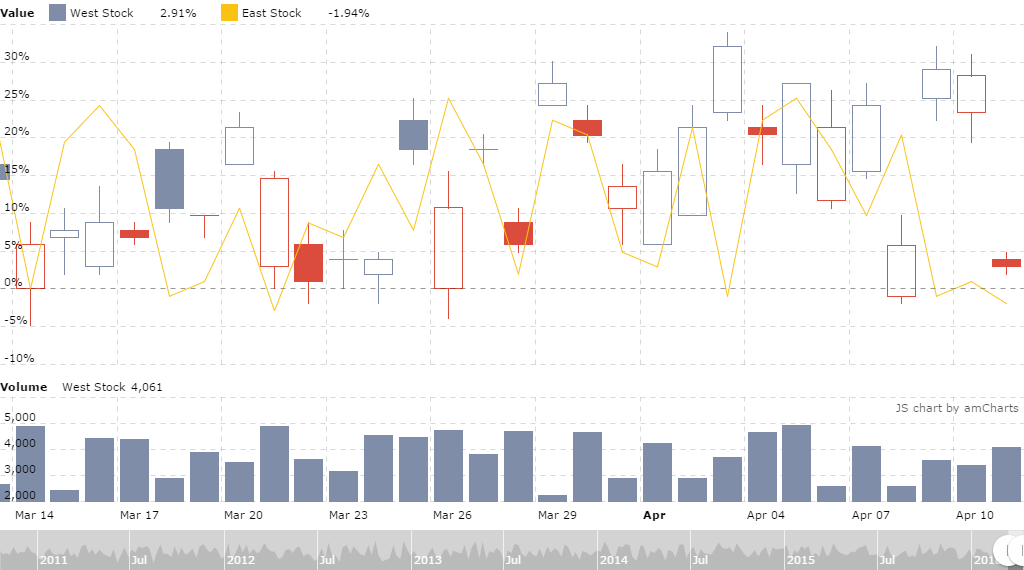
The StockChartGroup component allows you to create stock charts.
Stock chart supports multiple data sets and has a ready to use data set selector. Data sets might be compared one to another.

Stock chart can display a different kind of annotations on the graph or on the axis. These annotations are called stock events.
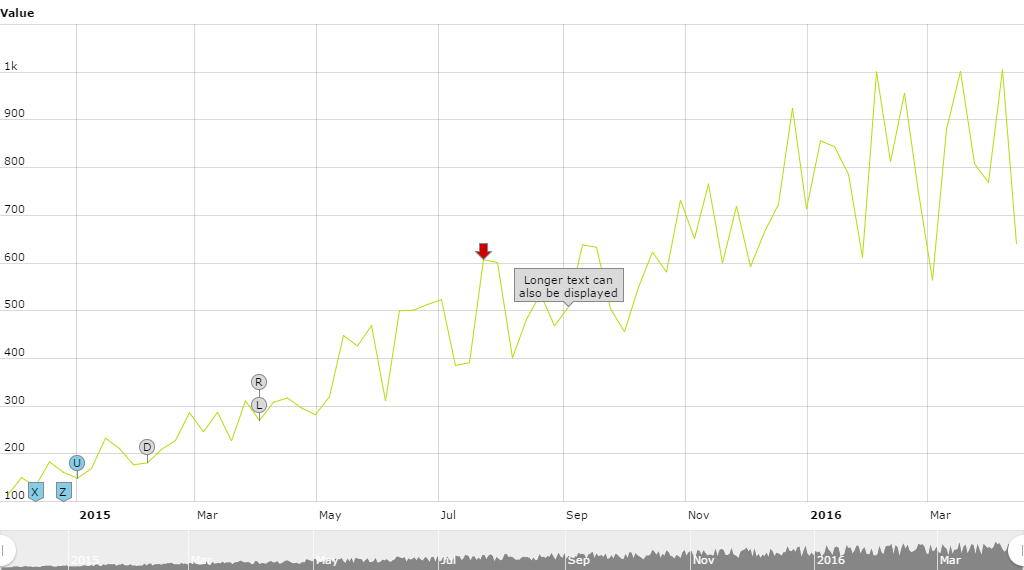
Stock chart can support any number of stock panels. Each Stock Panel can have any number of graphs. Each Stock Panel is a separate serial chart and is based on SerialChart and so it can do anything this chart can.
-
StockChartGroupevent listeners -
-
DataSetSelectorCompareListener- listener to dataset selector compare events. -
DataSetSelectorSelectListener- selection of the dataset selector. -
DataSetSelectorUnCompareListener- listener to the dataset selector uncompare events. -
PeriodSelectorChangeListener- selection of the display period with a selector. -
StockChartClickListener- click on the stock chart area. -
StockChartRightClickListener- right click on the stock chart area. -
StockEventClickListener- click on the stock event. -
StockEventRollOutListener- stock event roll-out. -
StockEventRollOverListener- stock event roll-over. -
StockGraphClickListener- click on the stock graph. -
StockGraphItemClickListener- click on the stock graph item. -
StockGraphItemRightClickListener- right click on the stock graph item. -
StockGraphItemRollOutListener- stock graph item roll-out events. -
StockGraphItemRollOverListener- stock graph item roll-over events. -
StockGraphRollOutListener- stock graph roll-out events. -
StockGraphRollOverListener- stock graph roll-over events. -
ZoomListener- scaling of the canvas. -
ZoomListener- scaling of the canvas.
-