4.2.8. Pivot Table Formatter
Pivot Table output type is available if the application project includes the charts component. For more information on Pivot Table see the Charts manual.
Pivot Table output can only be used as an additional report output, that’s why it is not available in the report wizard. To use the pivot table formatter, switch to the Templates tab in the report editor, click Create and select Pivot Table as the output type of the new template. After that, configure the template settings as described below.
The resulting table is displayed in the Reports → Show Pivot Tables screen of your web application.
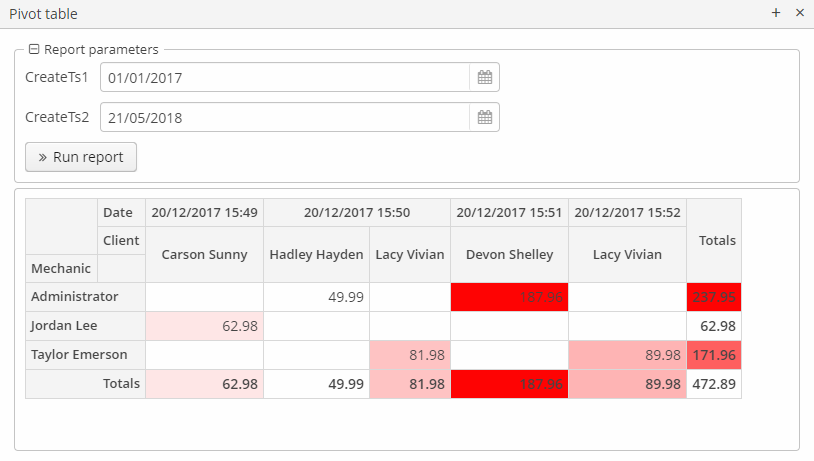
The report generator will get the band data and draw a table with drag-and-drop functionality, aggregation, and summary. Only one band can be used in the pivot report, nested bands are not supported.
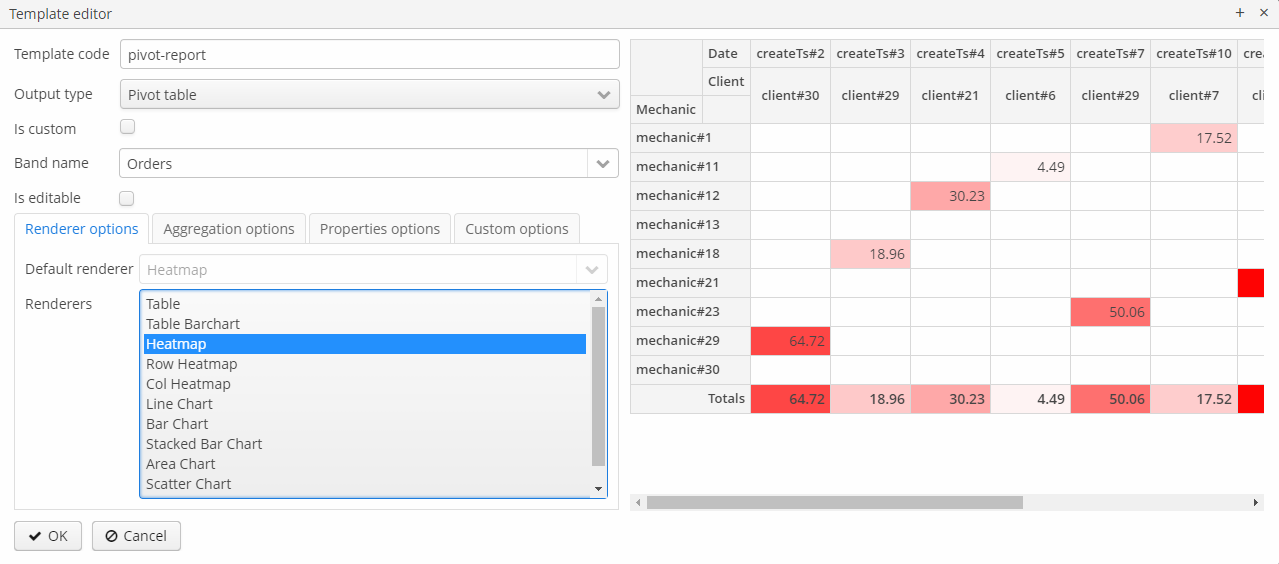
- Renderer options
-
This tab enables defining the collection of rendering functions that should be displayed in the list of available renderers in the UI and setting the default one.
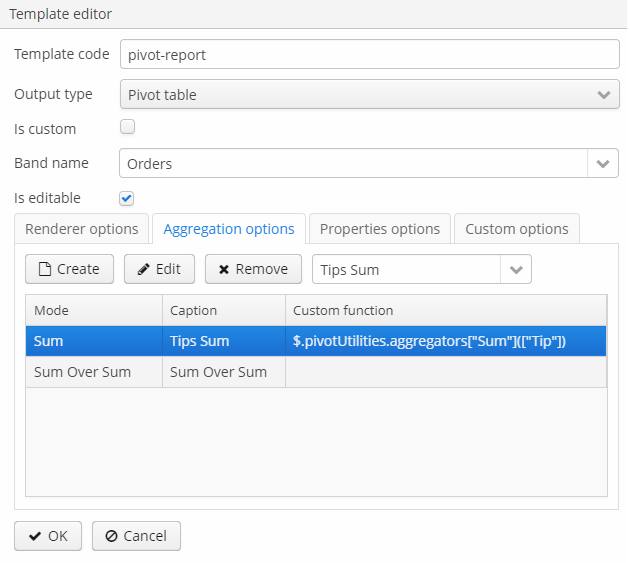
- Aggregation options
-
The Aggregation options tab allows you to define the list of table aggregators. Aggregation attributes:
-
Mode enables setting one of the predefined aggregation functions,
-
Caption is a localized value to be displayed in the UI,
-
Custom function – if not empty, the mode value is ignored in favor of the custom JavaScript code.
-
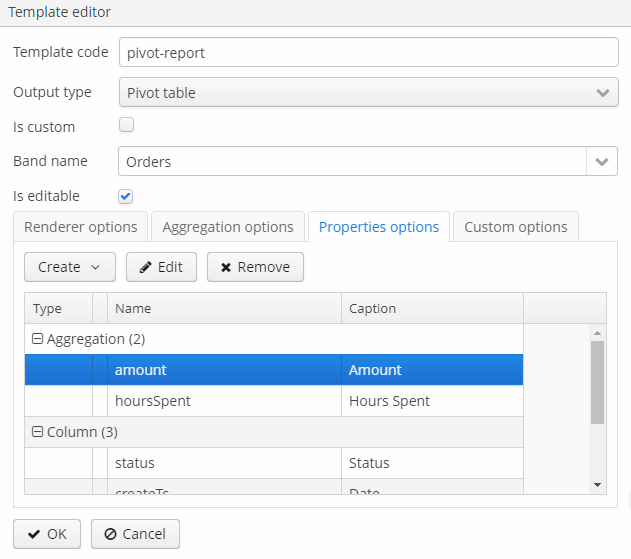
- Properties options
-
The pivot table displays all properties for all types of datasets. To be processed correctly, the aliases of reference attributes in SQL, JPQL and Groovy datasets should not contain periods, for example,
select u.name as "userName". The selected properties should be set as the pivot table’s properties on the Properties options tab of the template editor:-
Row, Column – a key-value map with the set of properties to be used in the pivot table columns and rows, where the key is the name of a dataset property and the value is its localized caption.
-
Aggregation – the properties that will be aggregated in each cell,
-
Derived property – can be used to add new attributes to the original data set, derived from the existing ones. This element is a key-value map, where the key is the name of a generated attribute, and the value is a JavaScript function that generates this attribute.
-
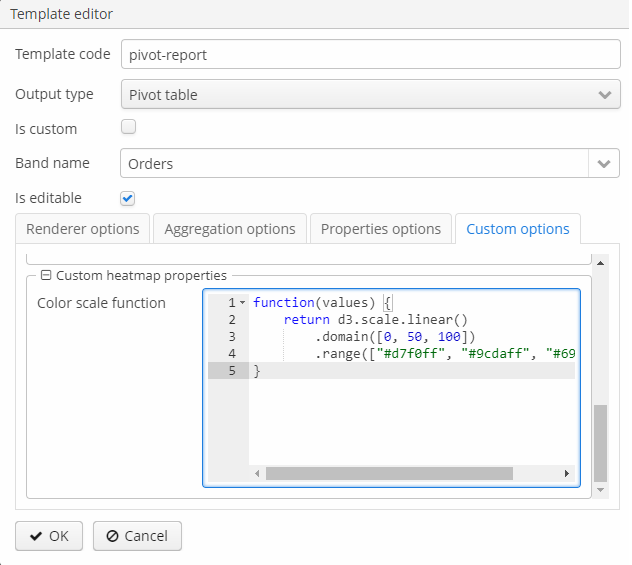
- Custom options
-
-
Filter function – JavaScript function that will be used for filtering.
-
Sorters function – JavaScript function that will be used for rows and columns captions sorting.
-
Renderer options, depending on the selected renderer, enable setting a JavaScript function that will be used to customize the renderer’s appearance. Actually, only two renderer types can be customized:
-
all kinds of
heatmap: the cell colors can be set by the Javascript code, -
all kinds of charts: options can be used to set the chart’s size.
-
-