3.5. Report with Chart Output
Using the report wizard, you can create reports with chart output in the same way as any other report types. The only difference is that you will need to configure the chart template after finishing the report in the wizard.
This example is based on the petclinic application, which source code is available at GitHub.
-
Add the Charts addon to your project via CUBA Add-Ons window as described in the Studio documentation.
-
Start creating a report as described in the previous chapters.
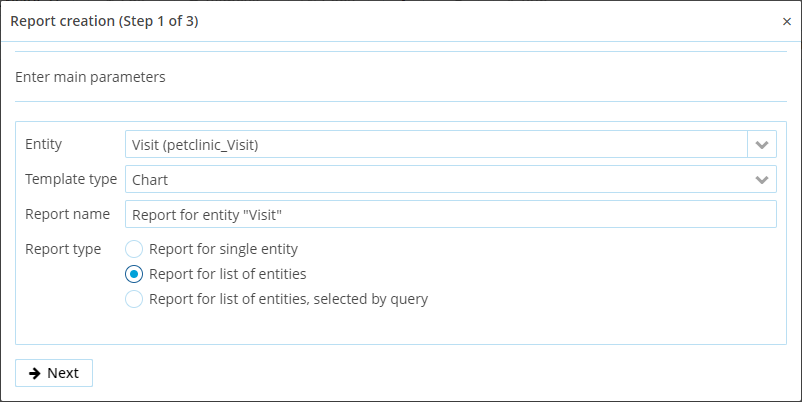 Figure 25. Chart Template in Wizard – Step 1
 -
For the chart report, select countable entity attributes – they will be later used for the value axis.
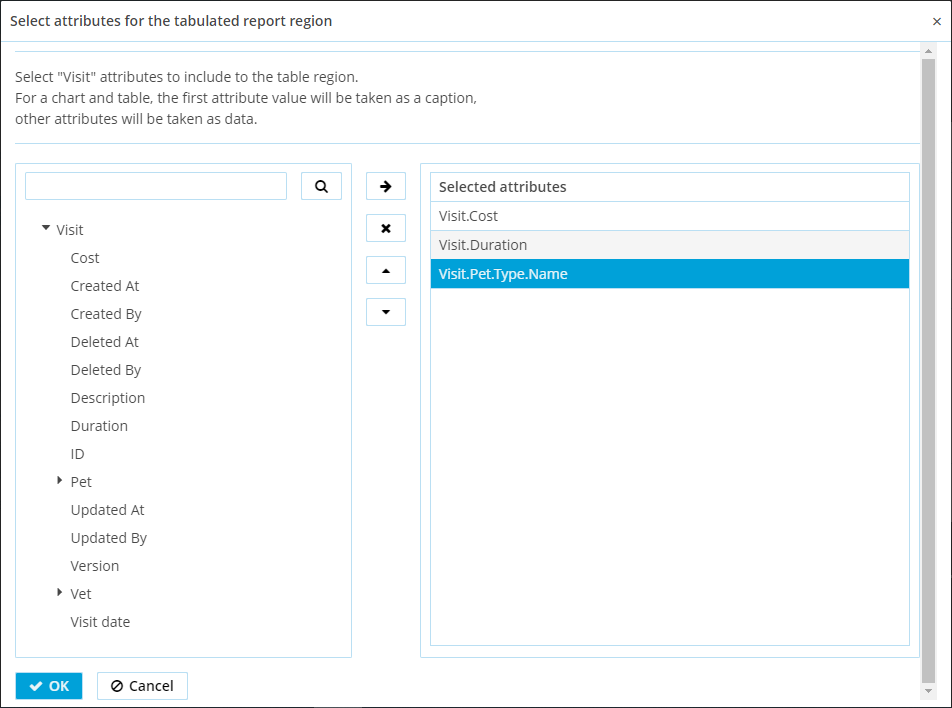 Figure 26. Chart Template in Wizard – Select Attributes
 -
Complete the next step of the report creation.
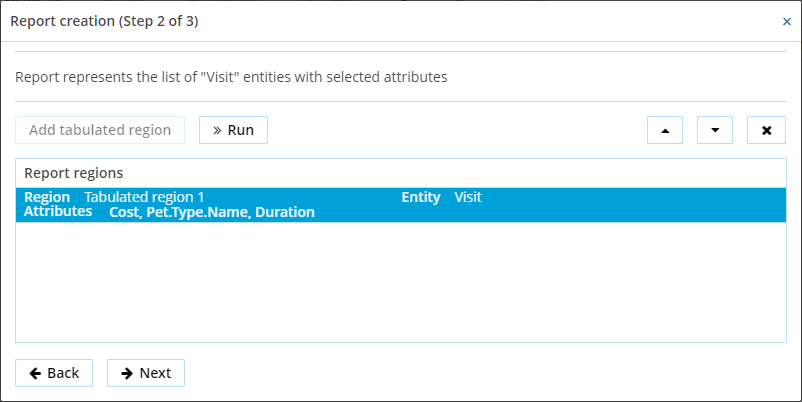 Figure 27. Chart Template in Wizard – Step 2
 -
At the last step, select the chart type – either Pie or Serial – and save the report.
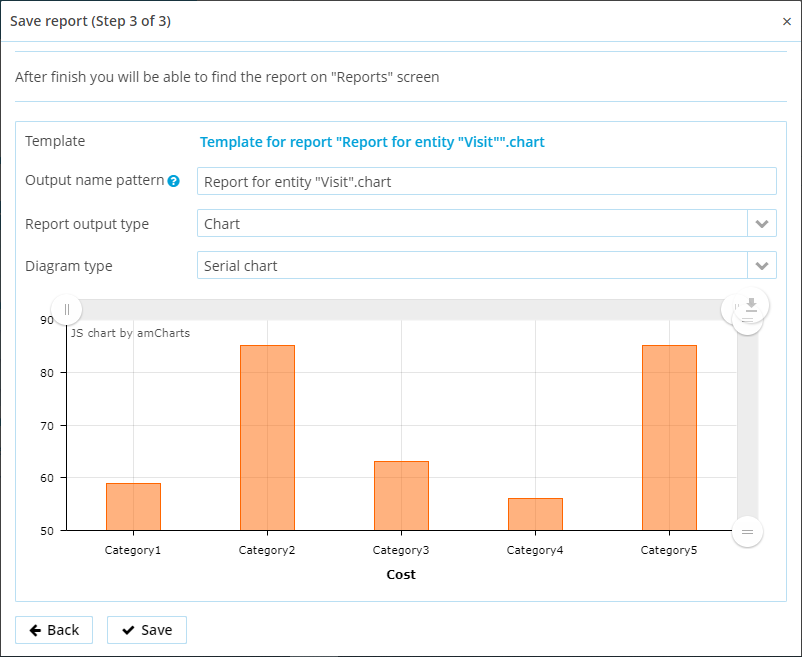 Figure 28. Chart Template in Wizard – Step 3
 -
Finally, configure the chart axis on the Templates tab of the report editor.
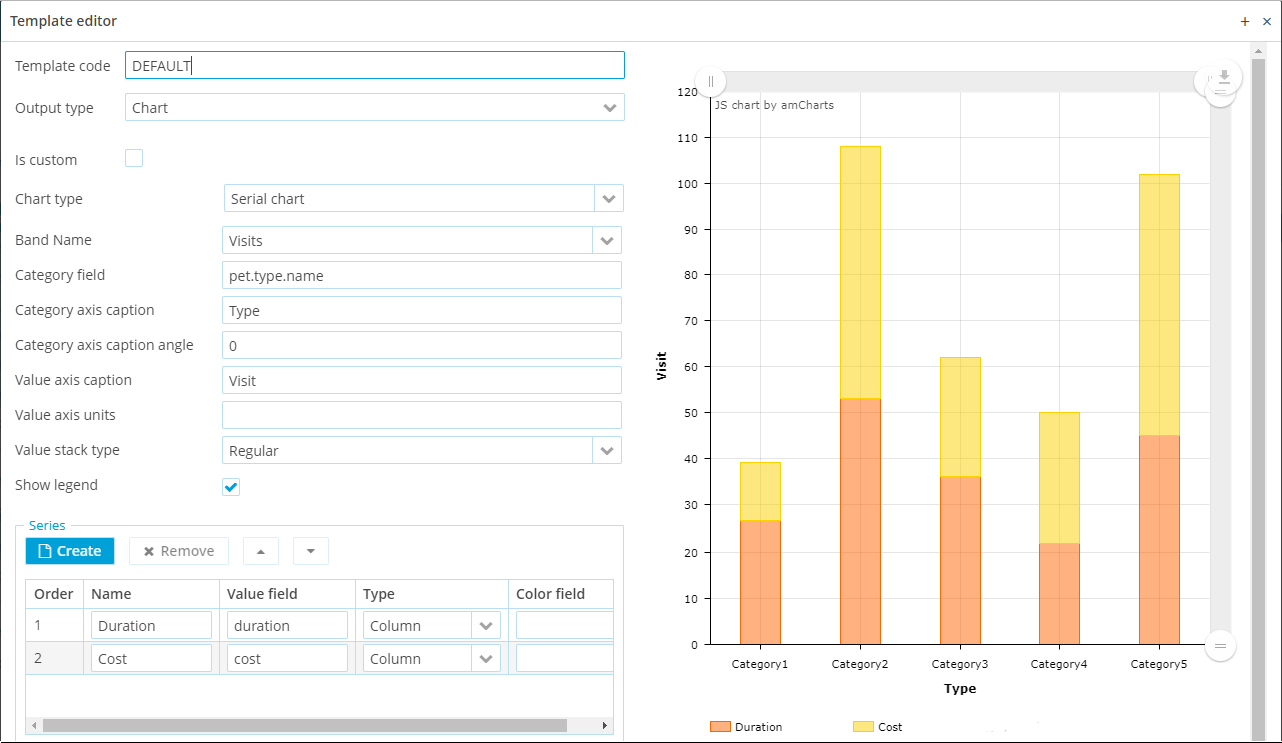 Figure 29. Chart Template Configuration
For more details on charts configuration, see the Charts documentation.