4.2.1. XLSX and XLS Templates
You can create XLSX and XLS templates using Microsoft Office or LibreOffice.
Each report band must have a corresponding region in the template, which is named as the band. For instance, a report has two bands – Header and Data. This means that template should also have Header and Data named ranges. To create named regions, select the desired cell ranges and enter the name in the field in the application top left corner. To edit existing named regions, use the Formulas → Name Manager menu command in Microsoft Office, and the Insert → Names → Manage command in OpenOffice. Vice versa, each part of the sheet you want to show should be a band in a report (at least an empty band).
The bands are output in the order specified in the report structure.
Bands can be horizontally and vertically oriented. If the band is horizontal, suitable named region will grow downward, vertical will grow rightward. Horizontal bands may be organized in tree-like structure and contain sub-bands (nested or children bands). Therefore, for sub-bands, you need to create named regions directly under the regions that correspond to the parent bands. XLSX formatter render children bands using the following algorithm:
-
Write the first row of parent band →
-
Write all first row’s children rows →
-
Write the next row of parent band.
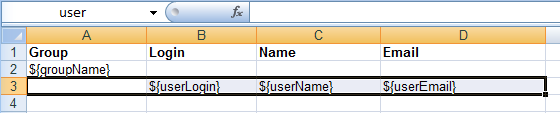
The band dataset fields are placed in the template using strings having ${field_name} format, where field_name is the corresponding band field name. For example:
You can add variables to the reporting template. Variables should be inserted into sheet names or the header/footer of XLSX template having ${<BandName>.<variableName>} format.
Cells may contain formatting as well as multiple fields inside. To output images or formulas, you need to place them entirely into the corresponding named region linked with the band.
Formulas can reference the cells of the same band or another band. To be processed by formatter, the formulas should use either range of cells in the band, or direct cells coordinates, e.g. (A1*B1) or ($B:$B).
To process the data as an Excel chart, create an empty band in the report structure and a named region with the same name in the template. Then create a chart inside this named region and make a reference to related bands using Select data button in the chart context menu. If your chart data is in a continuous range of cells, select any cell in that range. Your chart will include all the data in the range. If your data isn’t in a continuous range, select nonadjacent cells or ranges.
- Converting XLSX to PDF and CSV
-
XLSX reports can be automatically converted to CSV and PDF format. OpenOffice/LibreOffice should be installed for PDF conversion.
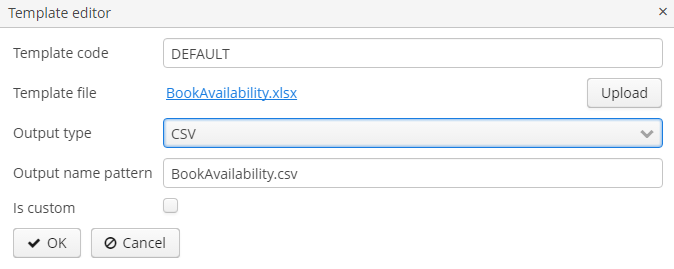 Figure 35. CSV Output