1.2.7. Chart Template
Chart output type is available if the application project includes the charts component. Resulting chart is displayed in the Reports → Show Charts screen of your web application.
Two types of diagrams are supported: Pie chart and Serial chart. Each type has its own set of parameters.
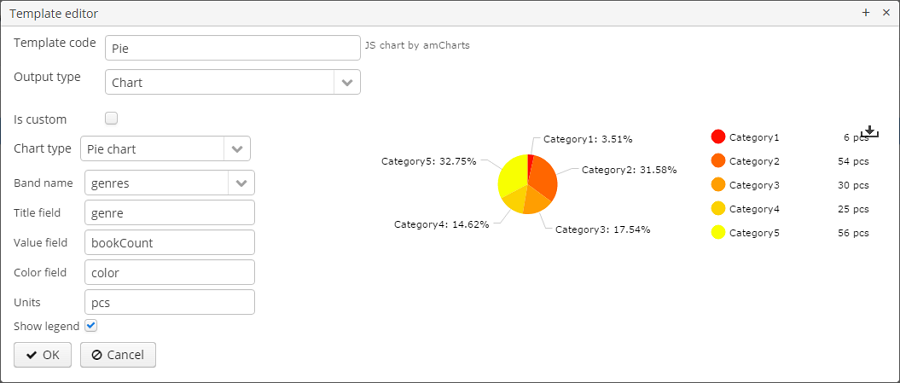
Pie chart:
-
Band name - a band providing data for the chart.
-
Title field - a field from which segment names will be taken.
-
Value field - a field from which segment values will be taken.
-
Color field - a field from which segment colors will be taken. The color value should be specified in the web format. If not defined, colours will be chosen automatically.
-
Units - this text will be added to legend values.
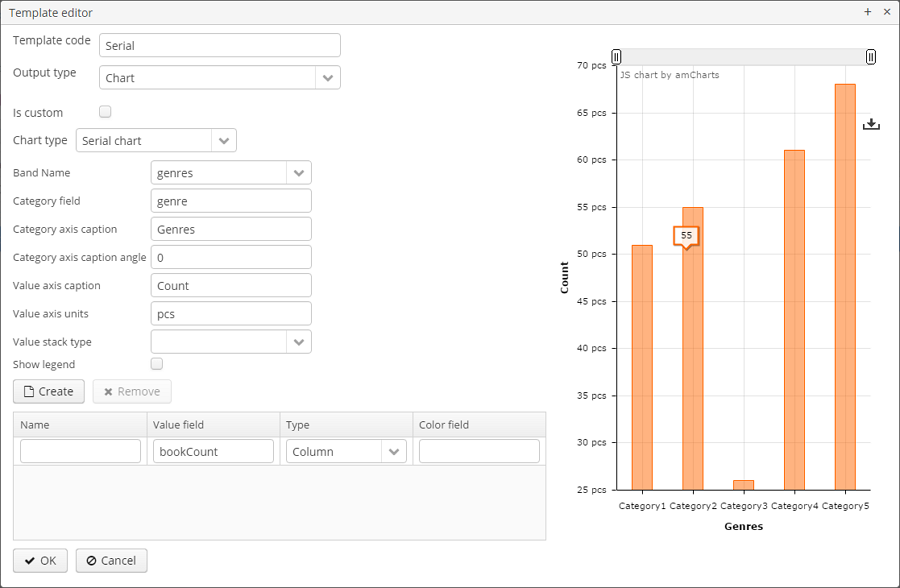
Serial chart:
-
Band name - a band providing data for the chart.
-
Category field - a field from which category names will be taken.
-
Category axis caption - a caption for the horizontal axis.
-
Value axis caption - a caption for the vertical axis.
-
Value axis units - this text will be added to values.
At least one row definition must be added for the serial chart:
-
Value field - a field from which row values will be taken.
-
Type - row display type.
-
Color field - a field from which segment colors will be taken. The color value should be specified in the web format. If not defined, colours will be chosen automatically.