2.5.6. SerialChart
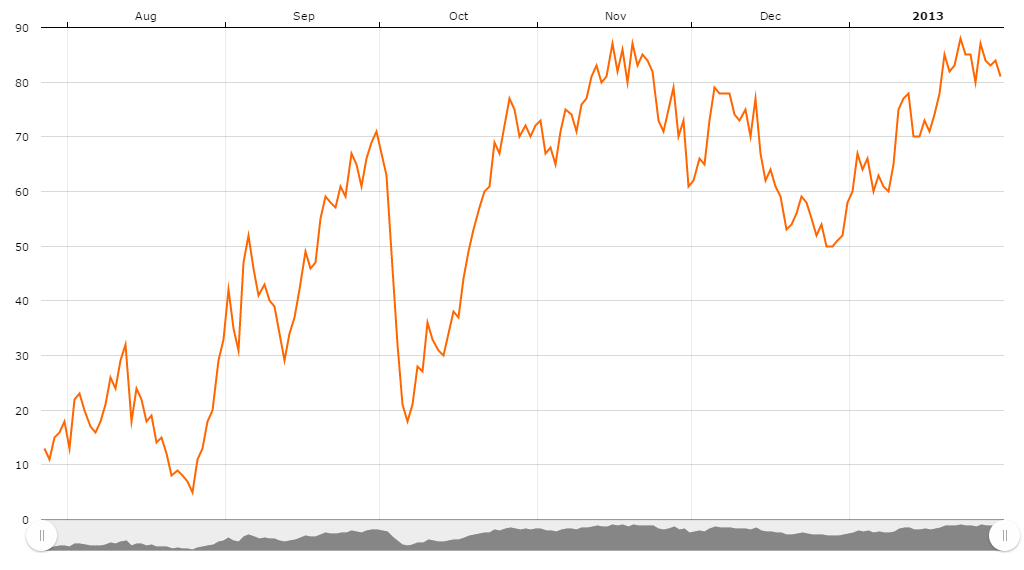
The SerialChart component allows you to create line, area, column, bar, step line, smoothed line, candlestick and OHLC charts. The charts support multiple axes with simple or logarithmic scales, the data points can be displayed at equal/irregular intervals or on timeline basis.

XML name of the component: chart:serialChart.
- Data binding:
-
You can assign a
CollectionContainerto the chart and then define thecategoryFieldattribute for theserialChartelement andvalueFieldattribute for the nestedgraphelement:<chart:serialChart categoryField="date" dataContainer="dateValueDc"> <chart:graphs> <chart:graph valueField="value" balloonText="[[value]]"> </chart:graph> </chart:graphs> <chart:categoryAxis dashLength="1" minorGridEnabled="true"/> </chart:serialChart> -
SerialChartevent listeners -
-
AxisZoomListener– chart axis scaling. -
CategoryItemClickListener– click on a category in the category axis. -
ChartClickListener– click on the canvas. -
ChartRightClickListener– right click on the canvas. -
CursorPeriodSelectListener– selection of the display period with a cursor. -
CursorZoomListener– scaling of the chart area with a cursor. -
GraphClickListener– click on a graph. -
GraphItemClickListener– click on a graph item. -
GraphItemRightClickListener– right click on a graph item. -
RollOutGraphListener– called when the user rolls-out of a graph. -
RollOutGraphItemListener– called when the user rolls-out of the data item. -
RollOverGraphListener– called when the user rolls-over a graph. -
RollOverGraphItemListener– called when the user rolls-over data item. -
ZoomListener– scaling of the canvas.
-
For more details, see AmCharts documentation.