2.5.8. XYChart
The XYChart component allows you to create XY/bubble/scatter charts. The charts support multiple axes with simple or logarithmic scales.
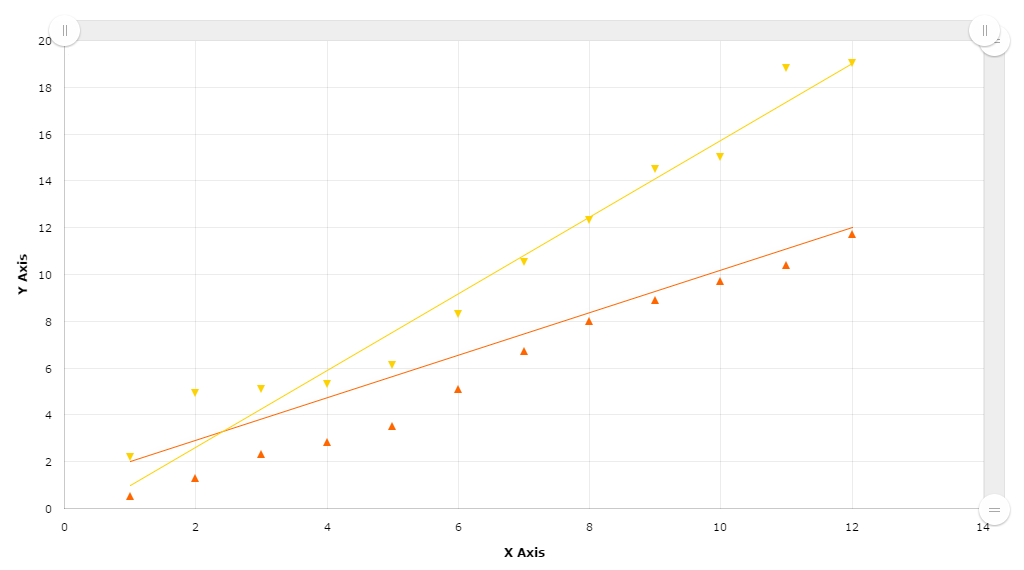
Figure 24. XYChart
XML name of the component: chart:xyChart.
- Data binding:
-
You can assign a
CollectionContainerto the chart and then define thexFieldandyFieldsattributes for the nestedgraphelements:<chart:xyChart dataContainer="pointPairDc" startDuration="1"> <chart:graphs> <chart:graph balloonText="x:[[x]] y:[[y]]" xField="ax" fillToAxis="x" yField="ay"/> <chart:graph balloonText="x:[[x]] y:[[y]]" fillToAxis="y" xField="bx" yField="by"/> </chart:graphs> <chart:valueAxes> <chart:axis id="x" axisAlpha="0" dashLength="1" position="BOTTOM" title="X Axis"/> <chart:axis id="y" axisAlpha="0" dashLength="1" position="LEFT" title="Y Axis"/> </chart:valueAxes> </chart:xyChart> -
XYChartevent listeners -
-
AxisZoomListener– chart axis scaling. -
ChartClickListener– click on the canvas. -
CursorPeriodSelectListener– selection of the display period with a cursor. -
CursorZoomListener– scaling of the chart area with a cursor. -
GraphClickListener– click on a graph. -
GraphItemClickListener– click on a graph item. -
GraphItemRightClickListener– right click on a graph item.
-
For more details, see AmCharts documentation.