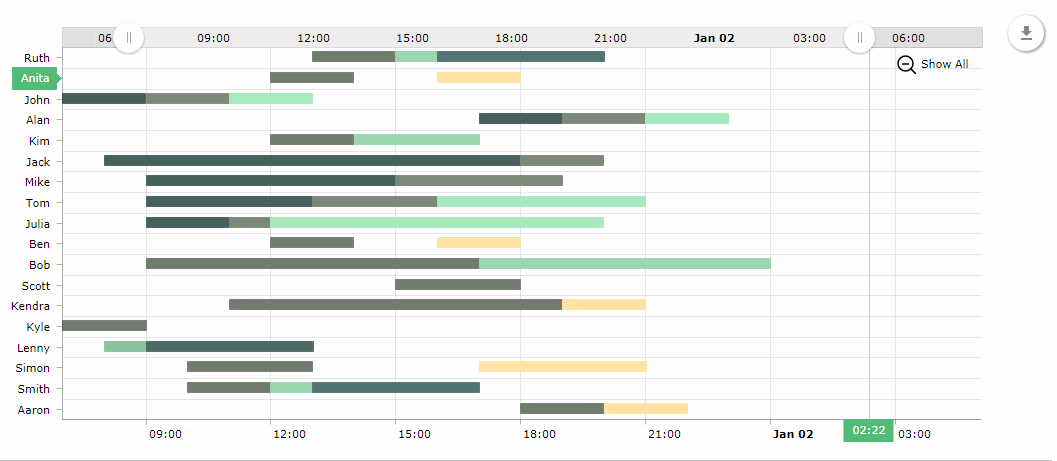
2.5.3. GanttChart
The GanttChart component allows you to create Gantt charts.
XML name of the component: chart:ganttChart.
-
Elements of
chart:ganttChart: -
-
categoryAxis– an element that describes the category axis. -
graph– an element that contains the collection ofchart:graphelements; the graph is described by thechart:graphelement.-
the
typeattribute defines the type of the graph and can be: line, column, step line, smoothed line, OHLC and candlestick. -
the
valueFieldattribute defines a key from the list of key-value pairs of data provider.
-
-
valueAxis– value axis of the chart. If the chart data is date- or time-based, you can set the value axis type todate.
-
-
Attributes of
chart:ganttChart: -
-
segmentsField– segments field of the chart. -
additionalSegmentFields– the list of additional segment fields that correspond to the entity attributes to be fetched from the data provider, similarly to the additionalFields attribute. -
endField/endDateField– the end value or the end date of the chart. -
startField/startDateField– the start value or the start date of the chart. -
startDate– the chart start date, if the value axis type is adate. -
categoryField– the category field of the chart.
-
- Data binding
-
You can assign a
CollectionContainerto the chart. In the example below thestartandendattributes of an entity are set for the attributesstartDateFieldandendDateField.<chart:ganttChart id="ganttChart" additionalSegmentFields="task" balloonDateFormat="JJ:NN" brightnessStep="7" categoryField="category" colorField="color" columnWidth="0.5" dataContainer="taskSpansDc" endDateField="end" height="100%" marginRight="70" period="DAYS" rotate="true" segmentsField="segments" startDate="2016-01-01" startDateField="start" theme="LIGHT" width="100%"> <chart:graph balloonText="<strong>[[task]]</strong>: [[open]] - [[value]]" fillAlphas="1" lineAlpha="1" lineColor="WHITE"/> <chart:valueAxis type="DATE"/> <chart:valueScrollbar autoGridCount="true" color="BLACK"/> <chart:chartCursor cursorAlpha="0" cursorColor="#55bb76" fullWidth="true" valueLineAlpha="0.5" valueBalloonsEnabled="false" valueLineBalloonEnabled="true" valueLineEnabled="true" valueZoomable="true" zoomable="false"/> <chart:export/> </chart:ganttChart> -
GanttChartevent listeners: -
-
AxisZoomListener– chart axis scaling. -
CategoryItemClickListener– click on a category in the category axis. -
ChartClickListener– click on the canvas. -
ChartRightClickListener– right click on the canvas. -
CursorPeriodSelectListener– selection of the display period with a cursor. -
CursorZoomListener– scaling of the chart area with a cursor. -
GraphClickListener– click on a graph. -
GraphItemClickListener– click on a graph item. -
GraphItemRightClickListener– right click on a graph item. -
ZoomListener– scaling of the canvas.
-
For more details, see AmCharts documentation.