1.5.2. Creating Chart with Simplified Data Binding
For the first example we will create the most simple chart using the simplified data binding API.
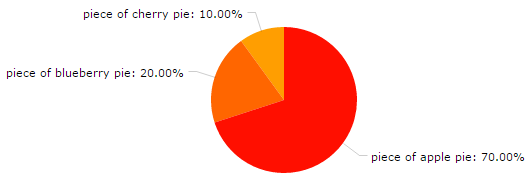
Add the chart component to the screen and use the addData() method to fill it with data, passing the MapDataItem instance with a set of key-value pairs as a parameter:
<chart:pieChart id="pieChart"
                titleField="key"
valueField="value"/>pieChart.addData(MapDataItem.of("key", "piece of apple pie",
"value", 70),
MapDataItem.of("key", "piece of blueberry pie",
"value", 20),
MapDataItem.of("key", "piece of cherry pie",
"value", 10));