1.2. Configuring Charts
Charts are displayed using the Chart component acting as a universal canvas. Chart type is defined by the subtype interface that inherits the Chart interface.
Charts can be described both in a screen XML-descriptor or in a screen controller. To do this, you should connect the corresponding namespace to the descriptor:
<window xmlns="http://schemas.haulmont.com/cuba/window.xsd"
        xmlns:chart="http://schemas.haulmont.com/charts/charts.xsd"
        ...>
XML elements corresponding to different chart types:
-
chart:xyChart- XYChart -
chart:serialChart- SerialChart -
chart:pieChart- PieChart -
chart:funnelChart- FunnelChart -
chart:gaugeChart- AngularGaugeChart -
chart:radarChart- RadarChart -
chart:ganttChart- GanttChart -
chart:stockChart- StockChart
Each chart type has its own set of attributes and methods, which replicate the functionality of the corresponding charts from AmCharts library. Documentation on the properties and methods of the charts is available at docs.amcharts.com/3/javascriptcharts.
Any configuration attribute can be set to null; in this case the system will use the default value (except the cases specified in the AmCharts documentation).
Configuring charts in a screen controller is performed following the same logic. You can configure a simple property, as well as a composite object set:
pieChart.setWidth("700px");
pieChart.setTitleField("description")
        .setValueField("value")
        .setStartAngle(312)
        .setLegend(new Legend()
                .setMarkerType(MarkerType.CIRCLE)
                .setPosition(LegendPosition.RIGHT)
                .setMarginRight(80))
        .addLabels(
                new Label()
                    .setText("Sample Chart")
                    .setSize(26)
                    .setBold(true)
                    .setAlign(Align.CENTER),
                new Label()
                    .setText("extra information")
                    .setAlign(Align.RIGHT))
        .setLabelTickColor(Color.GOLDENROD)
        .setColors(Arrays.asList(
                    Color.valueOf("#446493"),
                    Color.valueOf("#5E3D2C"),
                    Color.valueOf("#D0A557")))
        .setDatasource(valueDescriptionsDs);
To make the charts responsive, the responsive chart plugin is used. It enables scaling-down and -up chart visual features automatically in order to adjust the chart to the screen resolution changes. You can find more information on the responsive plugin on the AmCharts website.
The responsive element should contain the enclosed rules element where the rules of accommodation are defined. You can make the chart hide or show the legend, axis titles, guides, chart titles, zoom controls, move labels inside plot area and so on:
<chart:responsive enabled="true">
<chart:rules>
<chart:rule maxWidth="400">
<![CDATA[
{
"precision": 2,
"legend": {
"enabled": false
},
"valueAxes": {
"inside": true
}
}
]]>
</chart:rule>
</chart:rules>
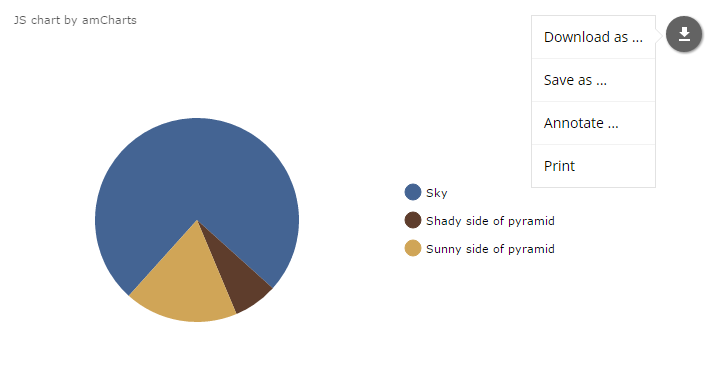
</chart:responsive>All charts can be exported from the running application as a picture or a source date. The chart:export element is used to create default export menu that enables the following options:
-
Download as… with available formats: PNG, JPG, SVG, PDF
-
Save as… with available formats: CSV, XLSX, JSON
-
Annotate… which is used to add personal notes and vector shapes to the chart. You can find information on the annotation plugin here.
-
Print that opens the standard print settings window.
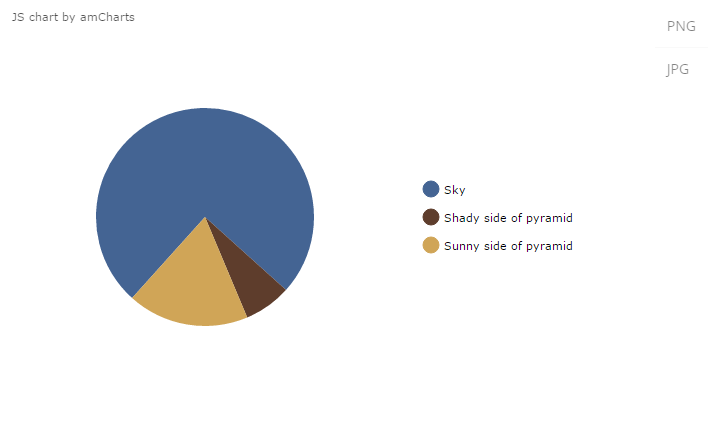
The export menu can be customized to limit user access to the chart data. Custom export menu can contain only image format(s), for example:
<chart:export fileName="my-chart" position="TOP_RIGHT">
    <chart:menu>
        <chart:item label="PNG" title="Save as PNG" format="PNG"/>
        <chart:item label="JPG" title="Save as JPG" format="JPG"/>
    </chart:menu>
</chart:export>
In this case only direct download buttons for chosen formats will be available: