3. Creating Reports
Creating a report in the system involves two dependent elements: visual presentation template and description of the data extracted for the report. The template is created in XLS(X), DOC(X), HTML formats using external tools, and the description of report data is created in the report designer screen.
Depending on the template and report parameters, the generated report can be in PDF, XLS(X), CSV, DOC(X), HTML, Chart, Table or Pivot table format.
The report data structure can either be described in the report designer by creating bands, queries and other elements, or programmed in a Java class that implements a special interface. The report can take parameters from the user or from the calling code. You can specify users who will have access to the report, and system screens where it should appear.
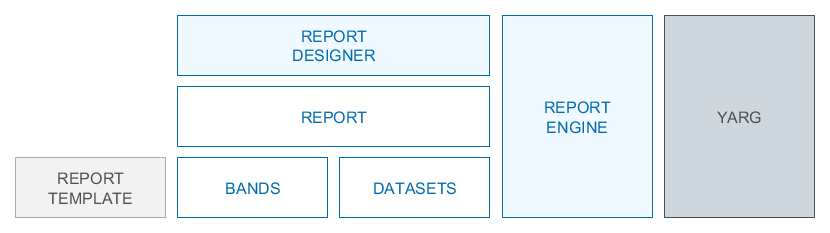
The main components of the report generator are shown in the following diagram:
-
YARG- framework, which is the core of the report generator. -
Report Engineintegrates YARG into CUBA platform and provides additional functionality such as access rights to reports and integration with screens. -
Report Designeris a tool for describing and storing reports. It includes the infrastructure for storing report descriptions and templates, as well as screens to create and manage reports. -
Report- report data structure descriptor, including Bands (report bands) and Datasets (datasets which are being output in the bands). -
Report Template- report visual presentation template.