1.2.1.1. Crosstab Reports
You can create a crosstab, or matrix, report using Microsoft Office or LibreOffice.
The report template should contain a horizontal band with a vertical child band, as report generator allows only horizontal bands to have children. The child band will use a result from the parent band as the query parameter.
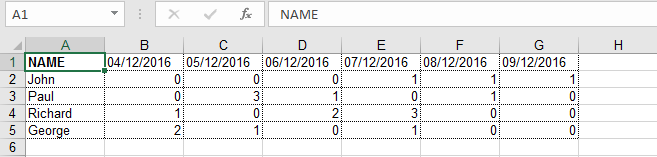
Below is an example of a template which outputs the list of Operators vertically and Calls made by each operator horizontally grouped by the dates of calls.
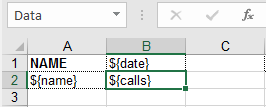
The vertical DataHeader band fills the report with call dates to the right:
select distinct c.dateOfCall as date from matrix$Call c order by c.dateOfCallThe horizontal Operators band lists the names of operators from up to down:
select o.name as name, o.id as operator_id from matrix$Operator o order by o.createTsThe nested vertical Data band uses the operators id from the parent band as a query parameter to fill the matrix:
def result = []

transactional { em ->
    def query = em.createQuery('select distinct c.dateOfCall from matrix$Call c order by c.dateOfCall ')
    query.resultList.each { date ->
        def query2 = em.createQuery('select c from matrix$Call c where c.operator.id = ? 1 and c.dateOfCall = ? 2 ')
        query2.setParameter(1, parentBand.getParameterValue('operator_id'))
        query2.setParameter(2, date)
        result.add(['calls': query2.resultList.size()])
    }
}
return result
As a result, the report is extended both vertically and horizontally: