4.1.3. Editable PivotTable
In the example below, we make the pivotTable editable and set the default aggregation function. In the editable mode, we can change the appearance (chart type) and the table content (rows and columns) directly in the UI.
<chart:pivotTable id="tipsPivotTableUI"
                  autoSortUnusedProperties="true"
                  dataContainer="tipsDc"
                  editable="true">
    <chart:properties>
        <chart:property name="row"/>
        <chart:property name="totalBill"/>
        <chart:property name="tip"/>
        <chart:property name="sex" localizedName="Sex"/>
        <chart:property name="smoker"/>
        <chart:property name="day"/>
        <chart:property name="time"/>
        <chart:property name="size"/>
    </chart:properties>
    <chart:hiddenProperties>
        <chart:property name="row"/>
    </chart:hiddenProperties>
    <chart:aggregationProperties>
        <chart:property name="tip"/>
        <chart:property name="totalBill"/>
    </chart:aggregationProperties>
    <chart:aggregations default="COUNT">
        <chart:aggregation caption="Count"/>
        <chart:aggregation mode="SUM_OVER_SUM"/>
    </chart:aggregations>
    <chart:renderers default="BAR_CHART"/>
    <chart:rows>
        <chart:row value="sex"/>
        <chart:row value="smoker"/>
    </chart:rows>
    <chart:columns>
        <chart:column value="day"/>
        <chart:column value="time"/>
    </chart:columns>
    <chart:sortersFunction>
        function(attr){
            if(attr=="Day"){
                return $.pivotUtilities.sortAs(["Mon","Tue","Wed","Thu","Fri","Sat","Sun"]);
            }
        }
    </chart:sortersFunction>
</chart:pivotTable>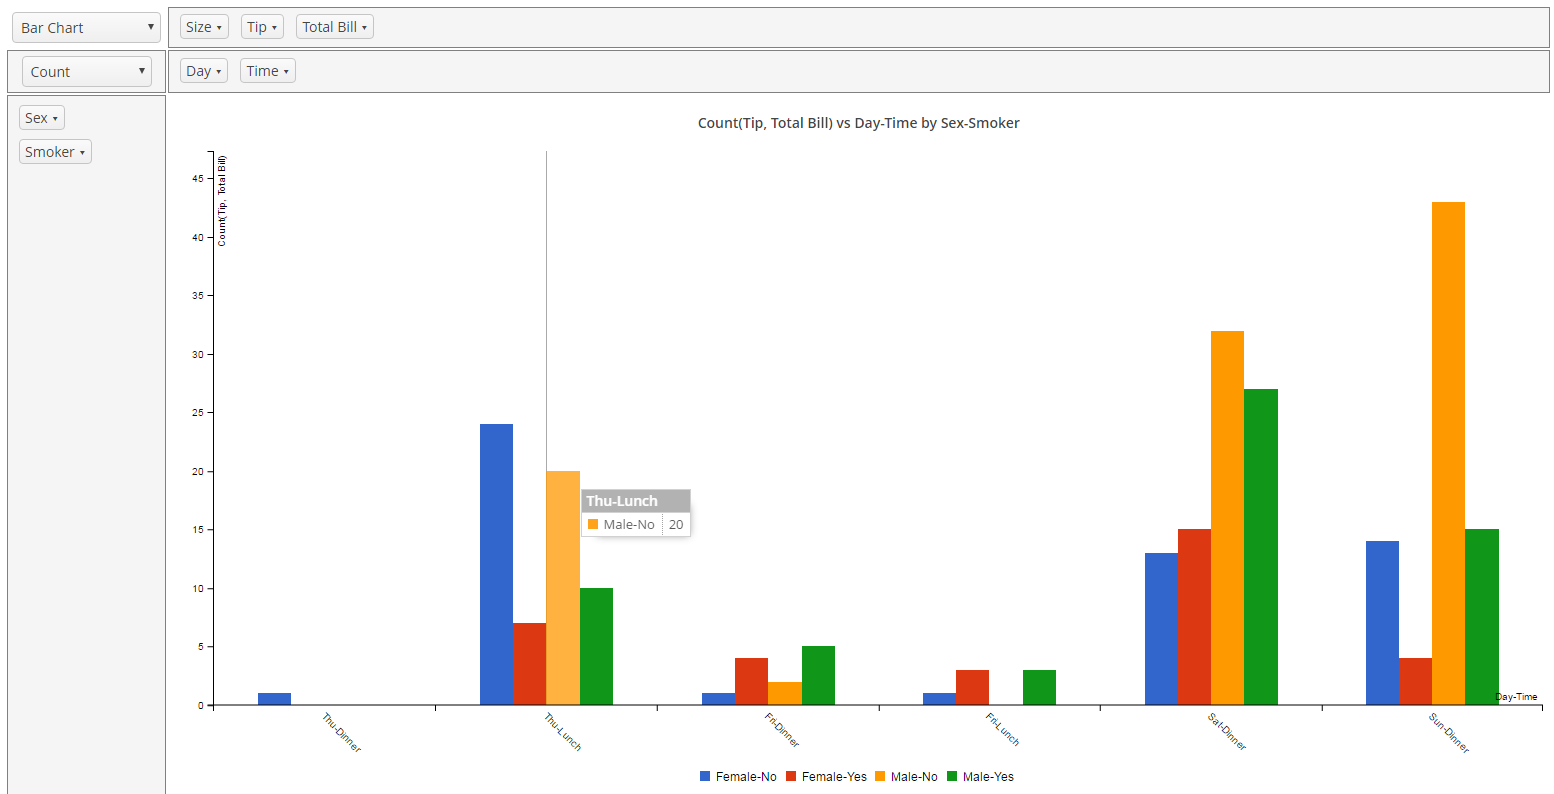
Figure 48. Editable PivotTable