4.1.3. Редактируемый PivotTable
В следующем примере представлен редактируемый pivotTable с предустановленной функцией агрегирования. В редактируемом режиме можно изменять внешний вид (тип графика) и содержание таблицы (строки и колонки) непосредственно в UI.
<chart:pivotTable id="tipsPivotTableUI"
                  autoSortUnusedProperties="true"
                  dataContainer="tipsDc"
                  editable="true">
    <chart:properties>
        <chart:property name="row"/>
        <chart:property name="totalBill"/>
        <chart:property name="tip"/>
        <chart:property name="sex" localizedName="Sex"/>
        <chart:property name="smoker"/>
        <chart:property name="day"/>
        <chart:property name="time"/>
        <chart:property name="size"/>
    </chart:properties>
    <chart:hiddenProperties>
        <chart:property name="row"/>
    </chart:hiddenProperties>
    <chart:aggregationProperties>
        <chart:property name="tip"/>
        <chart:property name="totalBill"/>
    </chart:aggregationProperties>
    <chart:aggregations default="COUNT">
        <chart:aggregation caption="Count"/>
        <chart:aggregation mode="SUM_OVER_SUM"/>
    </chart:aggregations>
    <chart:renderers default="BAR_CHART"/>
    <chart:rows>
        <chart:row value="sex"/>
        <chart:row value="smoker"/>
    </chart:rows>
    <chart:columns>
        <chart:column value="day"/>
        <chart:column value="time"/>
    </chart:columns>
    <chart:sortersFunction>
        function(attr){
            if(attr=="Day"){
                return $.pivotUtilities.sortAs(["Mon","Tue","Wed","Thu","Fri","Sat","Sun"]);
            }
        }
    </chart:sortersFunction>
</chart:pivotTable>
Результат:
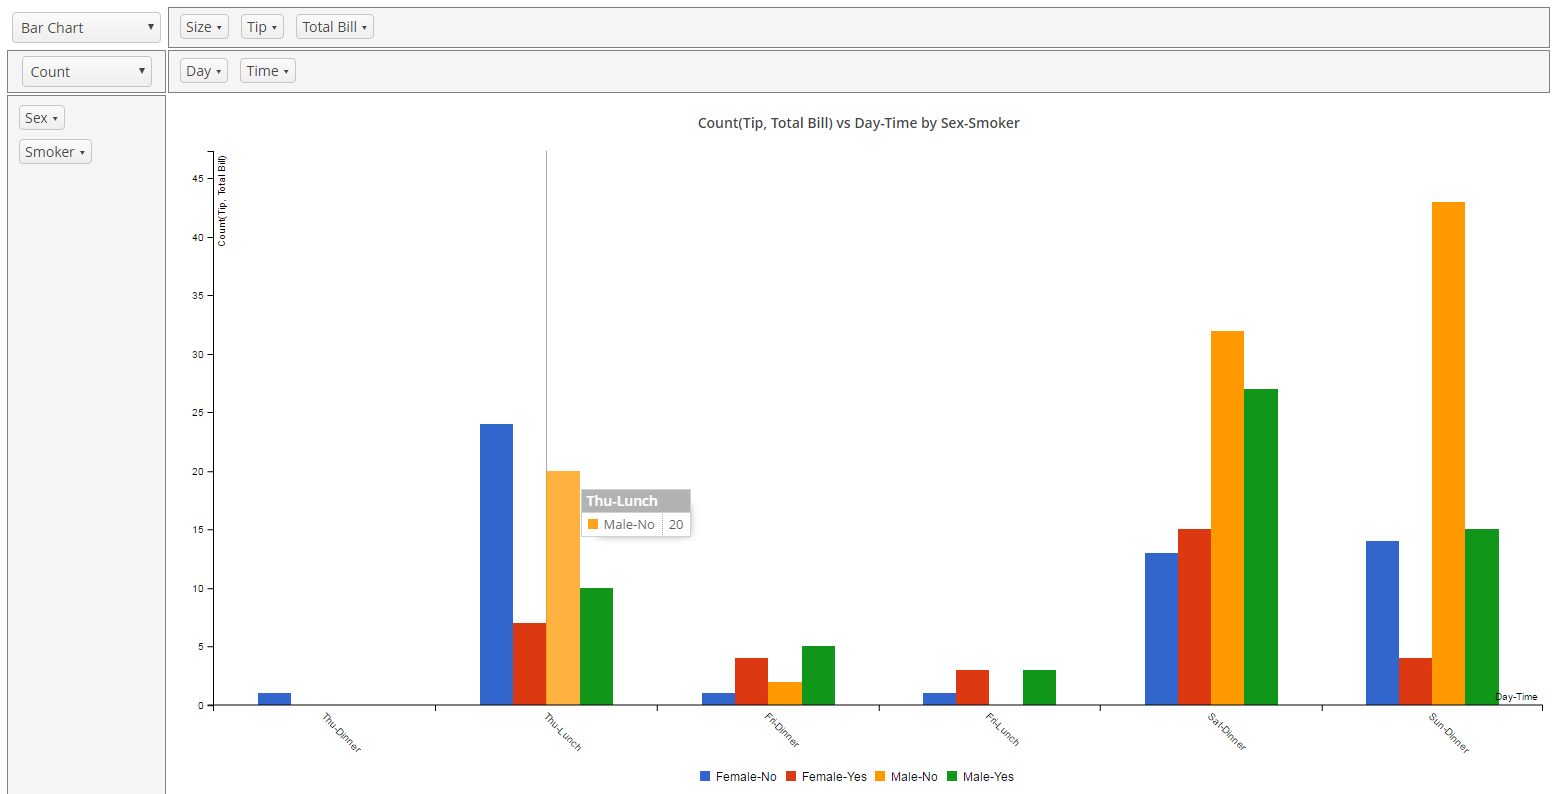
Рисунок 48. Редактируемая сводная таблица