2.6.5. Creating Chart with Incremental Data Update
This chart will retrieve data from a data container, and this data will be updated automatically. When new data is added to the data container, the chart is not refreshed completely: data points are added on the fly every 2 seconds. This approach will be useful, for example, for creating dynamically updated dashboards.
In this example we will show the dynamic of new orders amounts based on the Order entity from the Sales sample application.
-
Download the Sales application and add the charts component to it as described in Setting up the Application Project section.
-
Create a new screen in Studio. Call it orders-history, as it will display the history dashboard for new order entries.
-
Add the
serialChartcomponent to the screen layout. To use the incremental data update feature, we have to create a data container ofCollectionContainertype and bind the chart to it. We will not load the data from the container in this example, instead, the sample data will be generated on the fly, so you don’t need to create a loader.Set the
dateproperty for the category axis and theamountproperty for the value axis.<?xml version="1.0" encoding="UTF-8" standalone="no"?> <window xmlns="http://schemas.haulmont.com/cuba/screen/window.xsd" caption="msg://caption" messagesPack="com.company.sales.web" xmlns:chart="http://schemas.haulmont.com/charts/charts.xsd"> <data> <collection id="ordersDc" class="com.company.sales.entity.Order" view="_local"/> </data> <layout> <chart:serialChart id="orderHistoryChart" categoryField="date" dataContainer="ordersDc" width="100%"> <chart:graphs> <chart:graph valueField="amount"/> </chart:graphs> </chart:serialChart> </layout> </window> -
We will update the chart on the fly using a timer – a special UI component that will send HTTP-requests to the server side.
-
Switch to the Designer tab.
-
In the components palette find Timer in the Non-visual components group.
-
Drag this component to the screen components hierarchy panel.
-
Select the timer in the hierarchy panel and go to the Properties tab on the properties panel.
-
Set the timer id.
-
Let’s say the data should be updated every 2 seconds, so set the delay to 2000 milliseconds.
-
In the onTimer field we define the name of Java method –
updateChart. This method will be invoked each time the timer fires an event. Generate this method in the controller by clicking the >> button. -
Select repeating and autostart checkboxes.
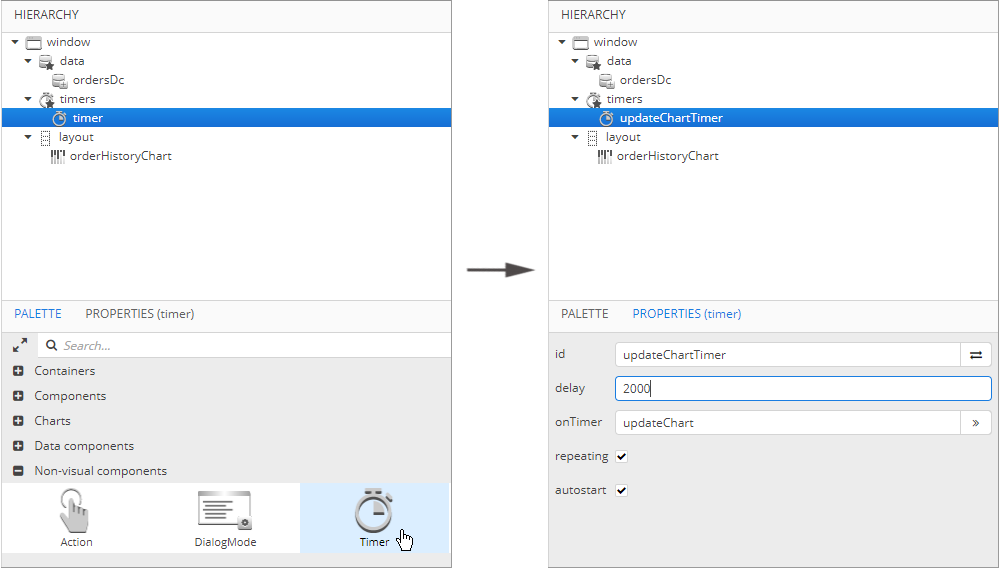 Figure 28. Creating a timer
-
-
Switch to the
OrdersHistorycontroller. Before starting to work on the timer logic, inject necessary dependencies:timeSource,metadataand the data container for theOrderentity. We will generate a newOrderinstance with random amount value each time the timer event is fired. The new instance is added to the collection data container using thegetMutableItems().add()method.Initialize the chart in the
onInit()method using the same logic for creating a randomOrderinstance.package com.company.sales.web; import com.company.sales.entity.Order; import com.haulmont.cuba.core.global.Metadata; import com.haulmont.cuba.core.global.TimeSource; import com.haulmont.cuba.gui.components.Timer; import com.haulmont.cuba.gui.model.CollectionContainer; import com.haulmont.cuba.gui.screen.*; import javax.inject.Inject; import java.math.BigDecimal; import java.util.Random; @UiController("sales_OrdersHistory") @UiDescriptor("orders-history.xml") public class OrdersHistory extends Screen { @Inject private Metadata metadata; @Inject private TimeSource timeSource; @Inject private CollectionContainer<Order> ordersDc; private Random random = new Random(42); @Subscribe private void onInit(InitEvent event) { Order initialValue = metadata.create(Order.class); initialValue.setAmount(new BigDecimal(random.nextInt(1000) + 100)); initialValue.setDate(timeSource.currentTimestamp()); ordersDc.getMutableItems().add(initialValue); } public void updateChart(Timer source) { Order orderHistory = metadata.create(Order.class); orderHistory.setAmount(new BigDecimal(random.nextInt(1000) + 100)); orderHistory.setDate(timeSource.currentTimestamp());; ordersDc.getMutableItems().add(orderHistory); } }At this stage the chart is already functional, but the data container size will increase rapidly, so we need to limit the number of items to be displayed.
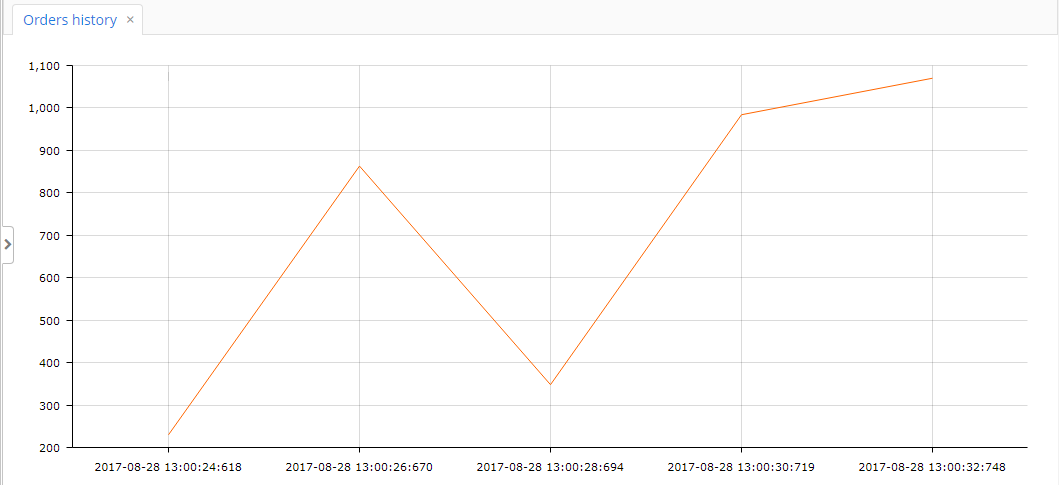 Figure 29. The data is automatically updated each 2 seconds
 -
Create a
Queueof orders. Each time the timer event is fired, the generated item is added to the top of theitemsQueue. When the queue size exceeds 10 items, the oldest item is excluded.private Queue<Order> itemsQueue = new LinkedList<>();public void updateChart(Timer source) { Order orderHistory = metadata.create(Order.class); orderHistory.setAmount(new BigDecimal(random.nextInt(1000) + 100)); orderHistory.setDate(timeSource.currentTimestamp());; ordersDc.getMutableItems().add(orderHistory); itemsQueue.add(orderHistory); if (itemsQueue.size() > 10) { Order item = itemsQueue.poll(); ordersDc.getMutableItems().add(item); } }
- Result
-
All the data is sent to the browser incrementally. If you open Chrome developer console on the Network tab, you will see that every 2 seconds our web page sends an HTTP request to the backend, and in response to that the backend sends very small JSON message. The JSON contains one
addand oneremoveoperation for the amount value. Thus, we do not re-send all the data.
