2.3. MapViewer Component
You can display maps in your application screens using the com.haulmont.charts.gui.components.map.MapViewer component.
To add the component, declare the chart namespace in the root element of the screen XML descriptor:
<window xmlns="http://schemas.haulmont.com/cuba/window.xsd"
        xmlns:chart="http://schemas.haulmont.com/charts/charts.xsd"
        ...>
XML-name of the component: mapViewer. Component declaration example:
<layout>
    <vbox id="mapBox" height="100%">
        <chart:mapViewer id="map" width="100%" height="100%"/>
    </vbox>
</layout>
You can define the following component parameters in the screen XML-descriptor:
-
id,width,height- standard component properties. -
mapType- map type corresponding to theMapViewer.Typeoptions:roadmap,satellite,hybrid,terrain. Default isroadmap. -
vendor- map service provider. Currently the only supported value isgoogle.
Main configuration of the map and its components is performed in a screen controller. For this, you only need to inject the component declared in the XML-descriptor:
@Inject
private MapViewer map;

@Override
public void init(Map<String, Object> params) {
    GeoPoint center = map.createGeoPoint(53.490905, -2.249558);
    map.setCenter(center);
}- Map configuration methods
-
-
fitToBounds()- sets the minimum map zoom as the one which will be sufficient to show in full an area limited by north-eastern and south-western coordinates. -
removePolygonVertex()- removes vertex from polygon. -
setCenter()- sets the map center point. -
setCenterBoundLimits()- sets map center possible locations bounds. -
setCenterBoundLimitsEnabled()- sets whether map center possible locations should be limited. -
setDraggable()- enables/disables map dragging mode. -
setKeyboardShortcutsEnabled()- enables/disables keyboard shortcuts. -
setMapType()- defines map type. -
setMaxZoom()- sets the maximum available zoom level. -
setMinZoom()- sets the minimum available zoom level. -
setRemoveMessage()- sets the popup message for vertex removal. -
setScrollWheelEnabled()- enables/disables map zoom with a mouse scroll wheel. -
setVertexRemovingEnabled()- toggles vertex removing availability. -
setVisibleAreaBoundLimits()- sets boundaries of the visible area of the map. -
setVisibleAreaBoundLimitsEnabled()- enables visible area limitation mode. -
setZoom()- sets the map zoom level.
-
- Map component interfaces
-
The interfaces listed below can be found in
com.haulmont.charts.gui.map.modelpackage.-
Circle- a component that displays a circle. ACircleproperties are similar to aPolygon, except that its shape is defined by two additional properties: center (GeoPoint) and radius. You can use thecreateCircle()andaddCircle()methods of theMapViewerinterface to create this object and put it on a map.Circle circle = map.createCircle(center, 130.5); circle.setDraggable(true);; circle.setFillOpacity(0.5); map.addCircleOverlay(circle);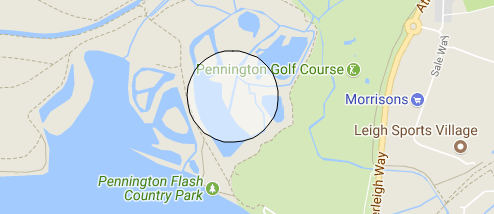
-
DrawingOptions- auxiliary drawing component. Only polygon drawing is currently supported. Drawing mode can be enabled by passing an instance ofDrawingOptionsto theMapViewer. Example:DrawingOptions options = new DrawingOptions(); PolygonOptions polygonOptions = new PolygonOptions(true, true, "#993366", 0.6); ControlOptions controlOptions = new ControlOptions( Position.TOP_CENTER, Arrays.asList(OverlayType.POLYGON)); options.setEnableDrawingControl(true); options.setPolygonOptions(polygonOptions); options.setDrawingControlOptions(controlOptions); options.setInitialDrawingMode(OverlayType.POLYGON); map.setDrawingOptions(options);
-
GeoPoint- an auxiliary component, which is not displayed on the map. This component can be used to set such map parameters as the center point, boundaries, or to create more complex map components. The object can be created using thecreateGeoPoint()`method of the `MapViewerinterface. For example:GeoPoint center = map.createGeoPoint(53.490905, -2.249558); map.setCenter(center);
-
HeatMapLayer- a map layer showing a heat map intended to display data density distribution across different geopoints. Data density is highlighted with color. By default, regions with higher points density are displayed in red and regions with lower density – in green. You can use thecreateHeatMapLayer()andaddHeatMapLayer()methods of theMapViewerinterface to create this object and put it on a map. For example:HeatMapLayer heatMapLayer = map.createHeatMapLayer(); List<GeoPoint> data = new ArrayList<>(); data.add(map.createGeoPoint(53.450, -2.090)); data.add(map.createGeoPoint(53.451, -2.095)); data.add(map.createGeoPoint(53.452, -2.092)); data.add(map.createGeoPoint(53.453, -2.093)); data.add(map.createGeoPoint(53.454, -2.093)); data.add(map.createGeoPoint(53.454, -2.092)); data.add(map.createGeoPoint(53.453, -2.092)); heatMapLayer.setData(data); map.addHeatMapLayer(heatMapLayer);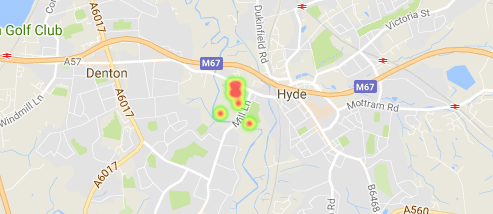
The data used for the heat map layer can be changed using a separate
setData()method. This change does not require re-adding the layer to the map.
-
InfoWindow- a map component that displays information in a pop-up window. You can use thecreateInfoWindow()andopenInfoWindow()methods of theMapViewerinterface to create this object and put it on a map. For example:InfoWindow w = map.createInfoWindow("Some text"); map.openInfoWindow(w);Information window can be tied to a marker, for example:
map.addMarkerClickListener(event -> {
    Marker marker = event.getMarker();
    String caption = String.format("Marker clicked: %.2f, %.2f",
            marker.getPosition().getLatitude(),
            marker.getPosition().getLongitude());
    InfoWindow w = map.createInfoWindow(caption, marker);
    map.openInfoWindow(w);
});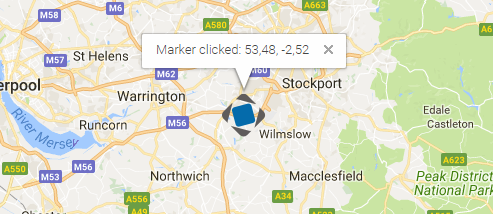
-
Label- a component to display a text label on the map.Labelcan be created and put on a map with thecreateLabel()andaddLabel()methods of theMapViewerinterface. It can be removed, in turn, with theremoveLabel()method. For styling, it supports HTML markdown.The
Labelcomponent has the following attributes:-
value- string value of the label. If the content type is set toHTML, the label value will be parsed by the browser. -
position- an implementation ofGeoPointthat represents the geographical position of the label. -
contentType- sets whether label value will be parsed as HTML or not. Can take 2 possible vales:PLAIN_TEXTandHTML. -
adjustment- sets the label adjustment relative to the itsGeoPointposition marker. -
styleName- sets additional stylename to the label.Label label = map.createLabel(); label.setValue("<span style=\"color: #ffffff; font-size: 24px;\">White label</span>"); label.setPosition(map.createGeoPoint(42.955, 32.883)); label.setAdjustment(Label.Adjustment.BOTTOM_CENTER); label.setContentType(Label.ContentType.HTML); map.addLabel(label);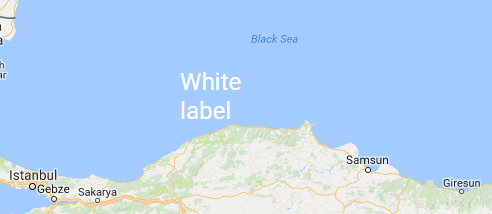
-
-
Marker- a component that marks a location on the map. By default, a standard icon of the map service vendor is used. You can use thecreateMarker()andaddMarker()methods of theMapViewerinterface to create this object and put it on a map. For example:Marker marker = map.createMarker("My place", map.createGeoPoint(53.590905, -2.249558), true); marker.setClickable(true); map.addMarker(marker);The
clearMarkers()method, in turn, removes all the markers from map.The
MarkerImageinterface is used to set a Marker icon or shadow image.MarkerImage markerImage = map.createMarkerImage("https://www.cuba-platform.com/sites/logo.png"); GeoPoint center = map.createGeoPoint(21.11, -76.20); markerImage.setSize(map.createSize(44, 44)); markerImage.setOrigin(map.createPoint(0, 0)); markerImage.setAnchor(map.createPoint(-5, 50)); Marker marker = map.createMarker("Cuba", center, true, markerImage); map.addMarker(marker);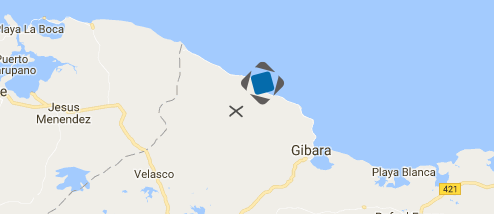
-
Polyline- a component that displays a polyline. You can use thecreatePolyline()andaddPolyline()methods of theMapViewerinterface to create this object and put it on a map. For example:List<GeoPoint> coordinates = new ArrayList<>(); coordinates.add(map.createGeoPoint(53.4491, -1.9955)); coordinates.add(map.createGeoPoint(53.6200, -1.9539)); coordinates.add(map.createGeoPoint(53.4425, -1.6196)); coordinates.add(map.createGeoPoint(53.1900, -1.4969)); coordinates.add(map.createGeoPoint(53.1926, -1.6197)); Polyline polyline = map.createPolyline(coordinates); polyline.setStrokeWeight(5); polyline.setStrokeOpacity(0.5); polyline.setStrokeColor("#7341f4"); map.addPolyline(polyline);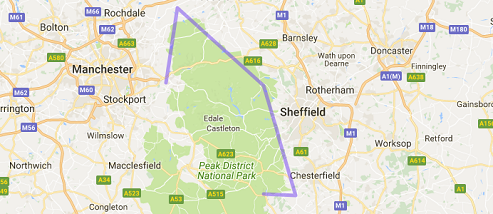
-
Polygon- a component that displays a polygon. You can use thecreatePolygon()andaddPolygonOverlay()methods of theMapViewerinterface to create this object and put it on a map. For example:List<GeoPoint> coordinates = new ArrayList<>(); coordinates.add(map.createGeoPoint(48.560579, 7.767876)); coordinates.add(map.createGeoPoint(48.561386, 7.782791)); coordinates.add(map.createGeoPoint(48.541940, 7.782861)); coordinates.add(map.createGeoPoint(48.545641, 7.768749)); Polygon p = map.createPolygon(coordinates, "#9CFBA9", 0.6, "#2CA860", 1.0, 2); map.addPolygonOverlay(p);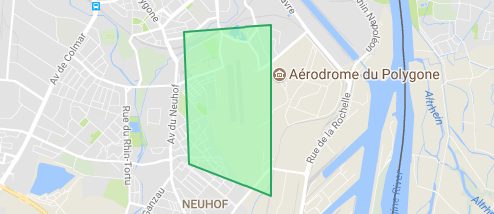
-
- Event listeners
-
The listener below are located in the
com.haulmont.charts.gui.map.model.listenerspackage.-
CircleCenterChangeListener- user changes the position of a circle center in map editing mode. -
CircleCompleteListener- user creates a circle in map editing mode. -
CircleRadiusChangeListener- user changes a circle radius in map editing mode. -
InfoWindowClosedListener- user closes an information window. -
MapInitListener- map initialization complete. This listener is invoked once after the first load of the map when all the tiles are loaded and coordinates are available. -
MapMoveListener- user drags a map with a mouse button pressed. -
MarkerDragListener- user drags a marker. -
PolygonCompleteListener- user creates a polygon in map editing mode. -
PolygonEditListener- user edits a polygon (moves or adds a vertex to an existing polygon).
Left click listeners:
-
CircleClickListener- user clicks on a circle. -
MapClickListener- user clicks on a map. -
MarkerClickListener- user clicks on a marker. -
PolygonClickListener- user clicks on a polygon.
Right click listeners:
-
CircleRightClickListener- user right-clicks on a circle. -
MapRightCLickListener- user right-clicks on a map. -
MarkerRightClickListener- user right-clicks on a marker. -
PolygonRightClickListener- user right-clicks on a polygon.
Double click listeners:
-
MarkerDoubleClickListener- user double-clicks on a marker. -
CircleDoubleClickListener- user double-clicks on a circle.
-
For a more detailed information about the methods and parameters of map components, please refer to the corresponding JavaDocs.