1.5.5. Configuration using JSON
In order to configure a chart, in addition to assigning XML attributes, you can use a custom JSON described in the AmCharts documentation.
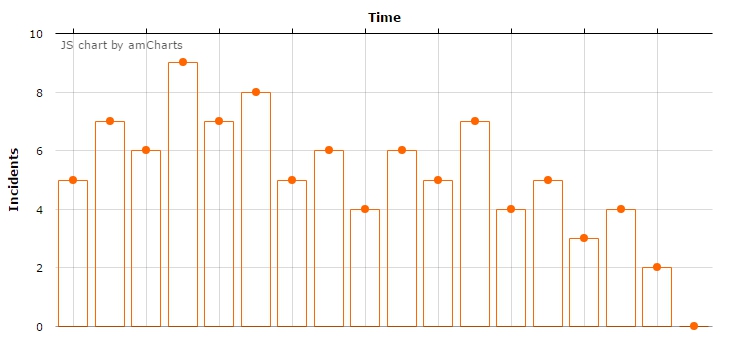
For example, we have a serial chart:
<chart:serialChart id="serialChart">
    <chart:valueAxes>
        <chart:axis axisAlpha="0" position="LEFT" title="Incidents"/>
    </chart:valueAxes>
    <chart:graphs>
        <chart:graph id="g1" bullet="ROUND" type="COLUMN" valueField="value"/>
    </chart:graphs>
    <chart:categoryAxis position="TOP" title="Time" labelsEnabled="false"/>
</chart:serialChart>
This chart have some data:
@Inject
protected Chart serialChart;

@Override
public void init(Map<String, Object> params) {
    super.init(params);

    ListDataProvider serialChartDataProvider = new ListDataProvider();
    int[] serialChartChartData = {5, 7, 6, 9, 7, 8, 5, 6, 4, 6, 5, 7, 4, 5, 3, 4, 2, 0};

    for (int i = 0; i < redLineChartData.length; i++) {
        serialChartDataProvider.addItem(graphData(serialChartChartData[i]));
    }

    SerialChart serialChartConfiguration = (SerialChart) serialChart.getConfiguration();
    serialChartConfiguration.setDataProvider(serialChartDataProvider);
}
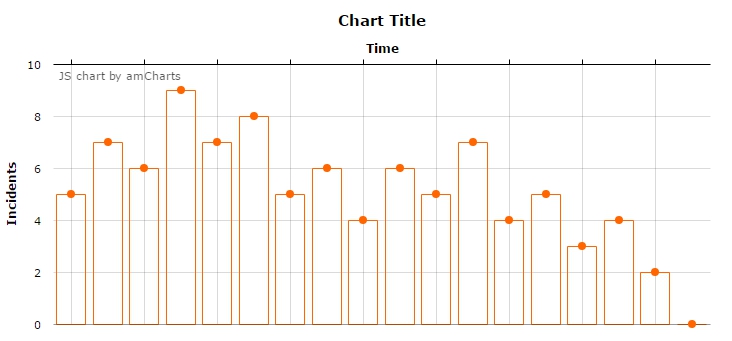
And now we can change the chart’s configuration. As an example, let’s add a title:
serialChart.setCustomJson("{\n" +
        " \"titles\": [\n" +
        " {\n" +
        " \"size\": 15,\n" +
        " \"text\": \"Chart Title\"\n" +
        " }\n" +
        " ]\n" +
        "}");
You can also set JSON configuration in the XML:
<chart:serialChart id="serialChart">
    <chart:customJson>
        <![CDATA[
        {
            "titles": [
                {
                    "size": 15,
                    "text": "Chart Title"
                }
            ]
        }
        ]]>
    </chart:customJson>
    <chart:valueAxes>
        <chart:axis axisAlpha="0" position="LEFT" title="Incidents"/>
    </chart:valueAxes>
    <chart:graphs>
        <chart:graph id="g1" bullet="ROUND" type="COLUMN" valueField="value"/>
    </chart:graphs>
    <chart:categoryAxis position="TOP" title="Time" labelsEnabled="false"/>
</chart:serialChart>