3.3.2. Create Data Source and Analysis Report Manually
- Create Data Source
-
-
Click New Data Source.
-
Select the Source Type: Database Table(s).
-
Select the new
BIDemoconnection in the list of available connections. -
Select Reporting and Analysis as the aim of this data source.
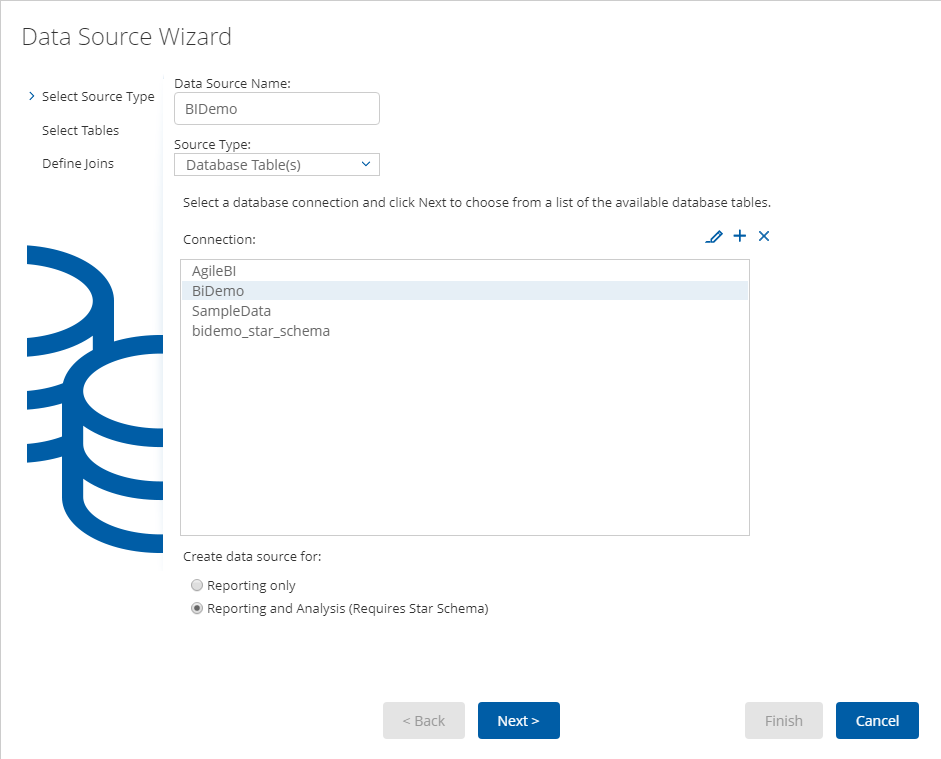 Figure 20. Data source wizard
 -
Select the dimensions and the fact tables we have created in Spoon:
"PENTAHO_DIM_CUSTOMER","PENTAHO_DIM_PRODUCT","PENTAHO_FACT_ORDER_LINE":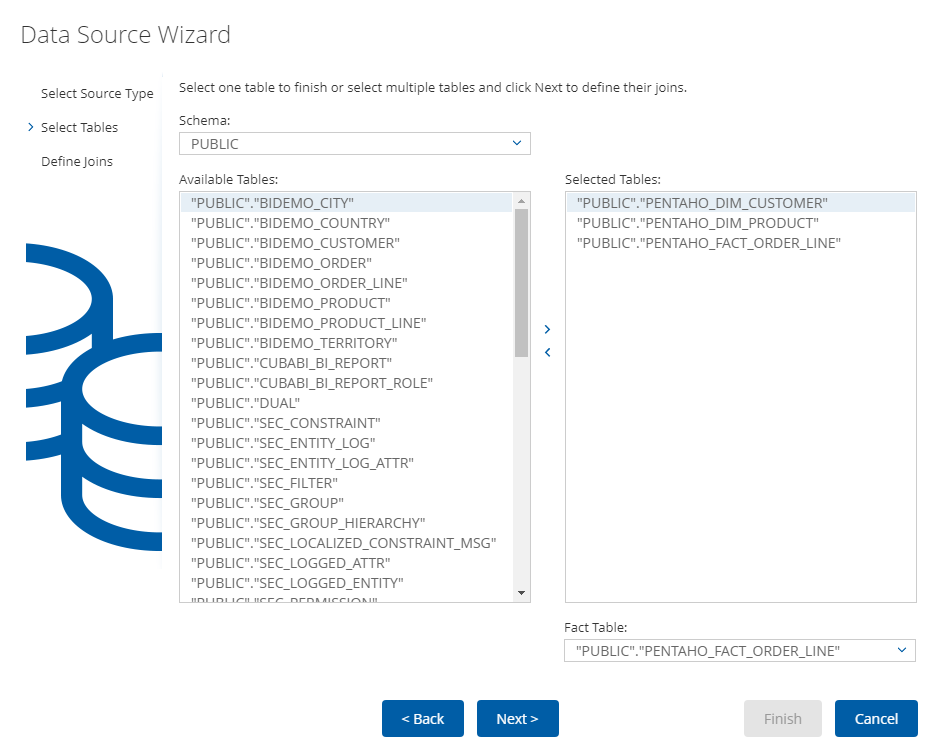 Figure 21. Data source wizard
 -
Define Joins for selected tables:
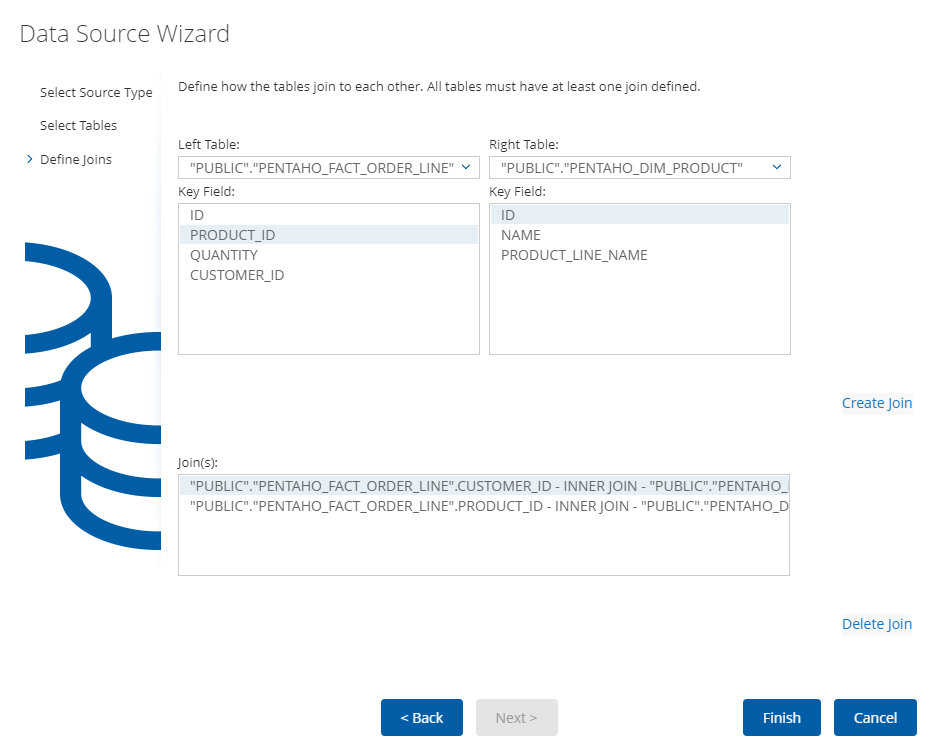 Figure 22. Data source wizard
 -
Customize the dimensions hierarchy:
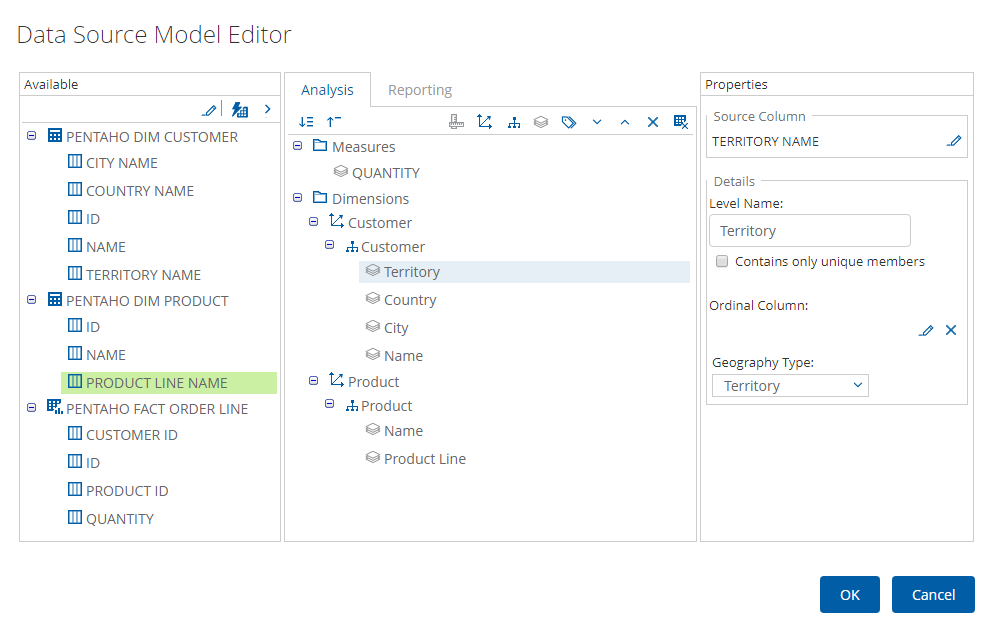 Figure 23. Data source model editor
 -
Save the data source. Select it in the list of available datasources and export the created analysis for the further use:
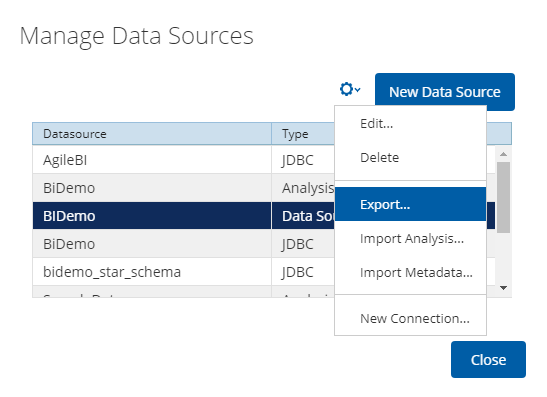 Figure 24. Export data source
-
- Create Analysis Report
-
-
Click New → Saiku Analytics → Create a new query. Select
BiDemocube and fill measure, columns, and rows as on the screen: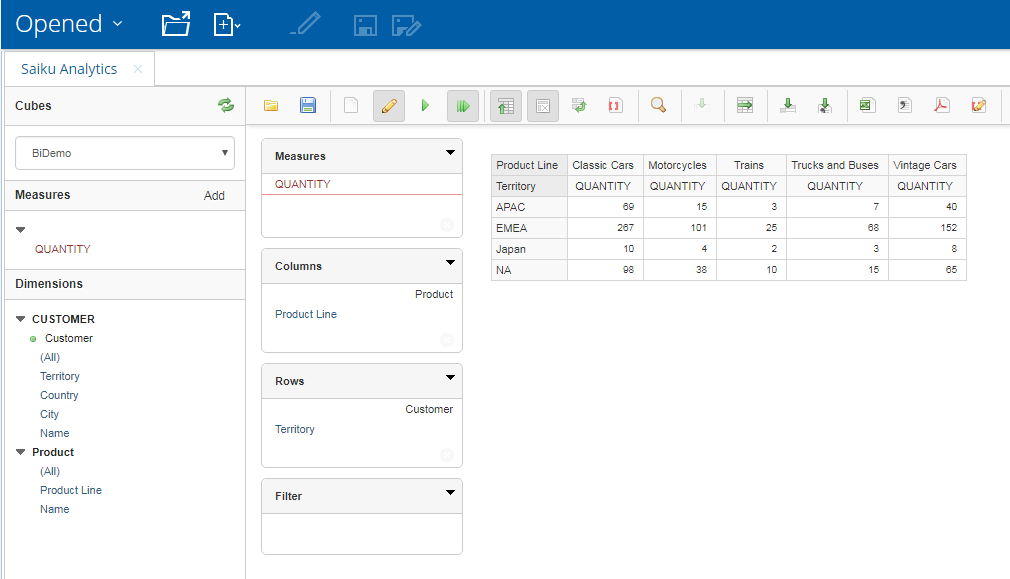 Figure 25. Create query
 -
Save report in the directory
/home/adminwith the nameProductsByTypeAndLocation.
Now you can open the Pentaho report in the CUBA application.
-