Preface
This document provides guidance for creating reports in applications built on CUBA platform.
Intended Audience
This manual is intended for developers and administrators of CUBA applications. In order to work successfully with the report generator, you should understand relational database principles and be able to write SQL queries. Familiarizing yourself with JPQL and Groovy is also useful, because in some cases it is easier to extract report data using these languages.
Further Reading
This Manual and the accompanying documentation related to the CUBA platform can be found at https://www.cuba-platform.com/manual.
The core of the platform report generator is the YARG framework, which is distributed under the free Apache 2.0 license. The framework documentation is available at https://github.com/Haulmont/yarg/wiki.
Feedback
If you have any suggestions for improvement of this Manual, please contact us at https://www.cuba-platform.com/support/topics.
If you find a mistake in the documentation, please specify the number of the chapter and attach a small abstract of surrounding text to help us locate the issue.
1. Creating Reports
Creating a report in the system involves two dependent elements: visual presentation template and description of the data extracted for the report. The template is created in XLS(X), DOC(X), HTML formats using external tools, and the description of report data is created in the report designer screen.
Depending on the template and report parameters, the generated report can be in PDF, XLS(X), DOC(X) or HTML.
The report data structure can either be described in the report designer by creating bands, queries and other elements, or programmed in a Java class that implements a special interface. The report can take parameters from the user or from the calling code. You can specify users who will have access to the report, and system screens where it should appear.
The main components of the report generator are shown in the following diagram:
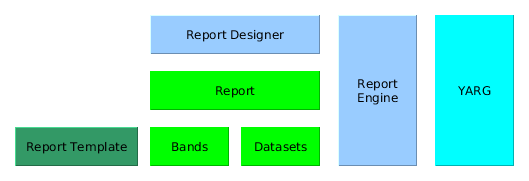
-
YARG- framework, which is the core of the report generator. -
Report Engineintegrates YARG into CUBA platform and provides additional functionality such as access rights to reports and integration with screens. -
Report Designeris a tool for describing and storing reports. It includes the infrastructure for storing report descriptions and templates, as well as screens to create and manage reports. -
Report- report data structure descriptor, including Bands (report bands) and Datasets (datasets which are being output in the bands). -
Report Template- report visual presentation template.
1.1. Report Data Structure
The Report structure tab of the report editor is described below:
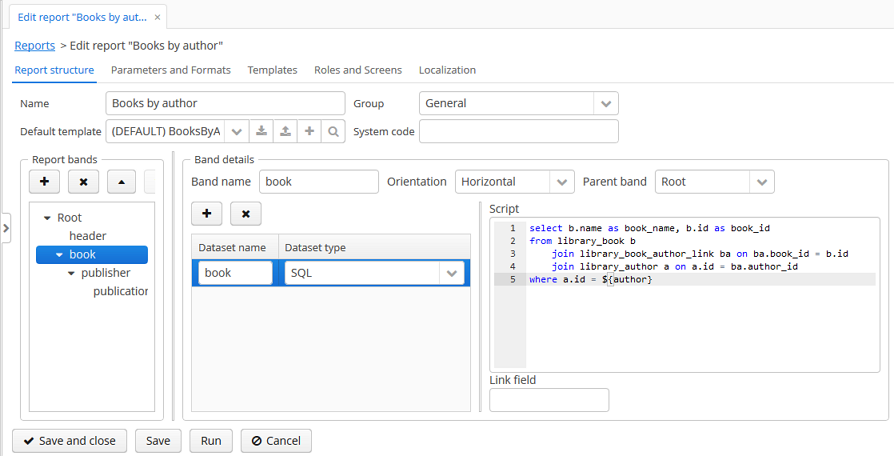
The top part contains fields to enter general report properties:
-
Name - report name. The name can be localized in the Localization tab.
-
Group - report group, which is used for grouping in the standard report browser.
-
Default template - report output template.
-
System code - optional code, which you may use to identify the report in the application code.
The main element of the report data structure is the band hierarchy - Report bands.
A report band has the following parameters:
-
Band name - unique band name within the report. It must contain only Latin letters, numbers and underscores.
-
Orientation - band orientation: Horizontal or Vertical. Horizontal bands are copied downwards, vertical - to the right. Horizontal bands may contain sub-bands.
-
Parent band - parent band.
Each band includes one or more datasets. At the moment when a report is run, datasets are transformed into lists of rows, where each row contains a map of name-value pairs. A band appears in the report as many times as there are rows in its longest dataset. Field names are specified in the report template and are replaced with corresponding values from the dataset when the report is produced. When describing datasets, you can use external parameters of the report as well as fields from other bands - this allows creating linked bands.
Each report has the Root band. You can create datasets in it and refer to their fields from other bands, but you cannot use the Root band in the report template.
The Dataset name column value is used for user convenience only.
Supported dataset types are provided below:
-
SQL - the dataset is produced as result of SQL query execution. It is recommended to use aliases for query result fields with the help of the
asoperator. It is also recommended to enclose the aliases in double quotes to prevent possible case conversion by the DBMS:select u.name as "userName", u.login as "userLogin" from sec_user uYou can use report input parameters and parent bands fields in the query. Parameters should be addressed by name enclosed in
${}, for example${dateFrom}. Parent band fields should be addressed similarly, by adding the band name in front of the field name:${band1.field1}.Below is an example of an SQL query with a
groupIdparameter, obtained from thegroupparent band and an externalactiveparameter:select u.name as "userName", u.login as "userLogin" from sec_user u where u.group_id = ${group.groupId} and u.active = ${active} and u.delete_ts is nullWarningYou should manually include conditions to filter soft deleted records for SQL queries.
By default, SQL queries are executed on the main database. If you want to query an additional data store (see Developer’s Manual), set its name in the Data store field.
-
JPQL - the dataset is produced as result of JPQL query execution. The resulted query fields must have aliases provided using the
asoperator. You can use report input parameters and parent bands fields in the JPQL query, similar to SQL query.Below is an example of a JPQL query with a
groupIdparameter, obtained from thegroupparent band and an externalactiveparameter:select u.name as userName, u.login as userLogin from sec$User u where u.group.id = ${group.groupId} and u.active = ${active}JPQL queries automatically support soft deletion and return only records which are not deleted.
By default, JPQL queries use entities mapped to the the main database. If you want to query entities from an additional data store (see Developer’s Manual), set its name in the Data store field.
-
Groovy - the dataset is produced as result of a Groovy script execution. The script must return an object of the
List<Map<String, Object>>type. Each element of this list - an object of theMap<String, Object>type - corresponds to one dataset record.The following objects are passed into the script:
-
params- external report parameters map. Below is an example to get a parameter value:def active = params['active'] -
parentBand- parent band as an object of thecom.haulmont.yarg.structure.BandDatatype. This object allows you to get a parent band field value by invoking thegetParameterValue()method, for example:def groupId = parentBand.getParameterValue('groupId') -
persistence- parent band as an object of thecom.haulmont.cuba.core.Persistencetype. You can use this object to get a parent band field value using theEntityManagermethod, for example:def tx = persistence.createTransaction() try { def em = persistence.getEntityManager() def query = em.createQuery('select g from sec$Group g') ... tx.commit() } finally { tx.end() }For working with an additional data store, pass its name as a parameter to
createTransaction()andgetEntityManager()methods. By default, the main database is used.def tx = persistence.createTransaction('myStore') try { def em = persistence.getEntityManager('myStore') ... tx.commit() } finally { tx.end() } -
metadata- an object of thecom.haulmont.cuba.core.global.Metadatatype, providing access the application metadata. For example:def metaClass = metadata.getClassNN('sec$User') -
transactional- a method that takes a closure, which should be executed in a new transaction, as parameter. The currentEntityManagerbecomes the closure parameter. For example:transactional { em -> def query = em.createQuery('select g from sec$Group g') ... }TipYou can use static methods of the
AppBeansclass to access any Spring beans of the middleware tier, for example:def dataWorker = com.haulmont.cuba.core.global.AppBeans.get('cuba_DataWorker')Below is an example of the Groovy script which extracts users by the group which is output in the parent band and by the
activeexternal parameter:def result = [] transactional { em -> def query = em.createQuery('select u from sec$User u where u.group.id = ?1 and u.active = ?2') query.setParameter(1, parentBand.getParameterValue('groupId')) query.setParameter(2, params['active']) query.resultList.each { user -> result.add(['userLogin': user.login, 'userName': user.name]) } } return result
-
-
Entity - the dataset consists of a single row and is produced using attributes of a single entity instance and the entities related to it.
The data source is produced from an external parameter of the Entity type, which must be described in the Parameters and Formats tab. The value in the Entity parameter name field must match the parameter name.
The report template must contain fields with entity attribute names. Attributes used in the template should be listed in the special window, which is invoked by the Select entity attributes button.
-
List of entities - the dataset is produced using a list of entity instances.
The data source is produced using an external parameter being a List of entities, which must be described in the Parameters and Formats tab. The value in the Entity parameter name field must match the parameter alias.
The report template must contain fields with entity attribute names. Attributes used in the template should be listed in the special window, which is invoked by the Entity attributes button.
1.2. Report Template
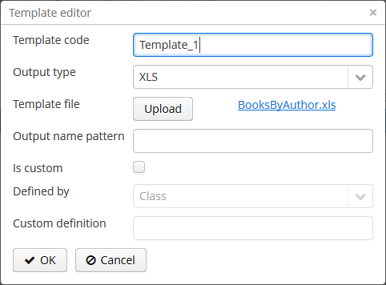
You can create several templates for a single report in the Templates tab of the report editor. One of them must be selected as the default template in the Report structure tab.
Below is the form to add a template:
-
Template code - template code for its identification.
-
Output type - report output type. It should be consistent with the template file type according to the rules described in Output format compliance matrix.
-
Template file - template file, which is loaded from the file system and saved to the database along with the report structure description.
-
Output name pattern - optional file name pattern, which will be used for the produced report download. It can either be a constant string or contain report parameter as a variable, e.g.
${header.authorName}.xlsx. More sophisticated patterns with several parameters and string concatenation can also be created as a script in any band of report structure, e.g.${Root.title}.xlsx, wheretitleis a result of the script:[['title' : ('Report for '+params['author'].firstName+' '+params['author'].lastName)]] -
Defined with class - flag to use the template defined by a class.
-
Custom class name - template class name used if the Defined with class flag is set.
1.2.1. XLSX and XLS Templates
You can create XLSX and XLS templates using Microsoft Office or LibreOffice.
Each report band must have a corresponding region in the template, which is named as the band. For instance, a report has two bands - Header and Data. This means that template should also have Header and Data named ranges. To create named regions, select the desired cell ranges and enter the name in the field in the application top left corner. To edit existing named regions, use the Formulas → Name Manager menu command in Microsoft Office, and the Insert → Names → Manage command in OpenOffice. Vice versa, each part of the sheet you want to show should be a band in report (at least an empty band).
The bands are output in the order specified in the report structure.
Bands can be horizontally and vertically oriented. If the band is horizontal, suitable named region will grow downward, vertical will grow rightward. Horizontal bands may be organized in tree-like structure and contain sub-bands (nested or children bands). Therefore, for sub-bands, you need to create named regions directly under the regions that correspond to the parent bands. XLSX formatter render children bands using the following algorithm:
-
Write the first row of parent band →
-
Write all first row’s children rows →
-
Write the next row of parent band.
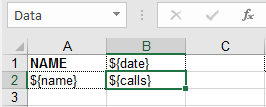
The band dataset fields are placed in the template using strings having ${field_name} format, where field_name is the corresponding band field name. For example:
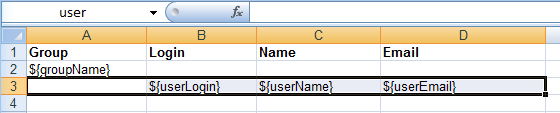
Cells may contain formatting as well as multiple fields inside. To output images or formulas, you need to place them entirely into the corresponding named region linked with the band.
Formulas can reference the cells of the same band or another band. To be processed by formatter, the formulas should use either range of cells in the band, or direct cells coordinates, e.g. (A1*B1) or ($B:$B).
To process the data as an Excel chart, create a band and a same-named region for this chart, and make a reference to related bands using Select data button in the chart context menu. If your chart data is in a continuous range of cells, select any cell in that range. Your chart will include all the data in the range. If your data isn’t in a continuous range, select nonadjacent cells or ranges.
1.2.1.1. Crosstab Reports
You can create a crosstab, or matrix, report using Microsoft Office or LibreOffice.
The report template should contain a horizontal band with a vertical child band, as report generator allows only horizontal bands to have children. The child band will use a result from the parent band as the query parameter.
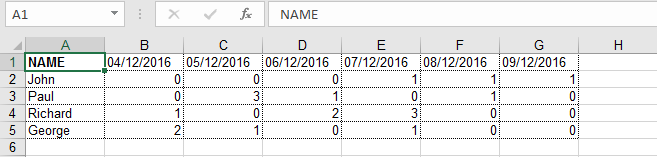
Below is an example of a template which outputs the list of Operators vertically and Calls made by each operator horizontally grouped by the dates of calls.
The vertical DataHeader band fills the report with call dates to the right:
select distinct c.dateOfCall as date from matrix$Call c order by c.dateOfCallThe horizontal Operators band lists the names of operators from up to down:
select o.name as name, o.id as operator_id from matrix$Operator o order by o.createTsThe nested vertical Data band uses the operators id from the parent band as a query parameter to fill the matrix:
def result = []

transactional { em ->
    def query = em.createQuery('select distinct c.dateOfCall from matrix$Call c order by c.dateOfCall ')
    query.resultList.each { date ->
        def query2 = em.createQuery('select c from matrix$Call c where c.operator.id = ? 1 and c.dateOfCall = ? 2 ')
        query2.setParameter(1, parentBand.getParameterValue('operator_id'))
        query2.setParameter(2, date)
        result.add(['calls': query2.resultList.size()])
    }
}
return result
As a result, the report is extended both vertically and horizontally:
1.2.2. DOCX and DOC Templates
You can create DOC and DOCX templates using Microsoft Office or OpenOffice / LibreOffice.
A template of these types can include document text and optionally one or more tables. The document text outputs the data from the first rows of arbitrary bands. In a table, you can output an arbitrary number of band rows.
To place a field in the document text, you should use a string having ${band_name.field_name} format, where band_name is the band name, field_name - name of a band’s field.
In order to output data into a table, you should tie it to a band. This is done by specifying ##band=band_name in the table’s first cell, where band_name is the band name. The table fields are placed using ${field_name} format, where field_name is the field name of the band associated with the table. You can use band name prefix to access fields of other bands, same as in the document text fields. You can output several fields in a single table cell.
Horizontal bands in DOCX and DOC cannot contain sub-bands. If you need to use sub-bands, you would better use XLS(X) format.
|
Warning
|
The table must contain either one or two rows. If the table has two rows, then the corresponding band fields must be in the second row. The first row should contain the marker with the corresponding band name and, if necessary, static text or other band fields. |
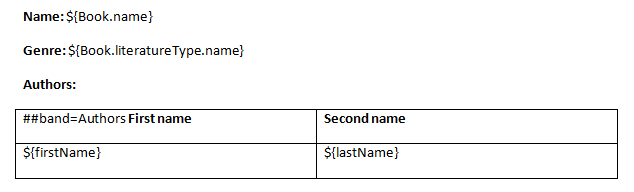
Below is an example of a template which outputs a report consisting of two bands, Book and Authors. The first band outputs a book name and genre, and the second outputs a list of authors of this book.
|
Warning
|
Cells data format is not supported in DOCX and DOC templates. To avoid numbers or dates formatting problems due to user’s locale, such as unnecessary numeric separators, try to cast your data to string. For example, wrap into |
1.2.3. HTML Template
An HTML template is defined in an .html file (UTF-8 encoding without BOM). FreeMarker tags are used to place data (FreeMarker documentation is available at http://freemarker.org/docs).
The FreeMarker document model has the following structure:
Band {
      bands [ bandName : [ band, .. ], .. ]
      fields [ fieldName : fieldValue, .. ]
}
For example, you should use the following expression to access the name field in a row having index 0 of the band band:
Root.bands.band[0].fields.nameYou may variables for convenience, e.g.:
<#assign headerRow = Root.bands.Header[0]>
<p>Date: ${headerRow.fields.reportDate}</p>
Below is an example of a template which outputs a report consisting of two bands, Book and Authors. The first band outputs a book name and genre, and the second outputs a list of authors of this book.
<!doctype html>
<html>
<head></head>
<body>
   <#assign book = Root.bands.Book[0] />
    <#assign authors = Root.bands.Authors />

    <p>Name: ${book.fields.name}</p>
    <p>Genre: ${book.fields.literatureType.name}</p>
    <table border="1" cellpadding="5" cellspacing="0" width="200">
        <thead>
            <tr>
                <td>First name</td>
                <td>Last name</td>
            </tr>
        </thead>
        <tbody>
        <#list authors as author>
            <tr>
                <td>${author.fields.firstName}</td>
                <td>${author.fields.lastName}</td>
            </tr>
        </#list>
        </tbody>
    </table>
</body>
</html>
Below is a more complex example. Let us assume we have the following bands structure:
Root {
    HeaderBand {
        query = return [[ "name" : "Column1" ],[ "name" : "Column2" ]]
    }
    Band1 {
        query = return [
            ["field1" : "Value 11", "field2" : "Value 12"],
            ["field1" : "Value 21" , "field2" : "Value 22"]
        ]
    }
    Band2 {
        query = return [[ "header" : "Header1" ], [ "header" : "Header2" ]]
        SubBand1 {
            query = return [["header" : 'SubHeader1'] , [ "header" : 'SubHeader2' ]]
        }
    }
}-
Inserting a field:
<!doctype html>
<html>
    <head>
        <title> Simple template </title>
    </head>
    <body>
        <#assign Tree1 = Root.bands.Band2>
        <h1> Header </h1>
        <p>
            ${Tree1[1].bands.SubBand1[0].fields.header}
        </p>
    </body>
</html>-
Inserting a list:
<!doctype html>
<html>
    <head>
        <title> List </title>
    </head>
    <body>
        <#assign Table1Header = Root.bands.HeaderBand>

        <#if Table1Header?has_content>
        <ol>
            <#list Table1Header as header>
            <li> ${header.fields.name} </li>
            </#list>
        </ol>
        </#if>
    </body>
</html>-
Inserting a table:
<!doctype html>
<html>
    <head>
        <title> Table </title>
    </head>
    <body>
        <#assign Table1Header = Root.bands.HeaderBand>
        <#assign Table1 = Root.bands.Band1>
        <table border="1" cellpadding="5" cellspacing="0" width="200">
            <thead>
                <tr>
                <#list Table1Header as header>
                    <td> ${header.fields.name} </td>
                </#list>
                </tr>
            </thead>
            <tbody>
            <#list Table1 as row>
                <tr>
                    <td>
                        ${row.fields.field1}
                    </td>
                    <td>
                        ${row.fields.field2}
                    </td>
                </tr>
            </#list>
            </tbody>
        </table>
    </body>
</html>-
Inserting a multi-level list:
<!doctype html>
<html>
    <head>
        <title> Multi-level list </title>
    </head>
    <body>
        <#assign Tree1 = Root.bands.Band2>
        <ul>
            <#list Tree1 as item>
            <li>
                <h2> ${item.fields.header} </h2>
                <#if item.bands.SubBand1?has_content>
                <ul>
                    <#list item.bands.SubBand1 as subitem>
                    <li>
                        <h3> ${subitem.fields.header} </h3>
                    </li>
                    </#list>
                </ul>
                </#if>
            </li>
            </#list>
        </ul>
    </body>
</html>
1.2.3.1. Converting HTML to PDF
Reports which have a template in HTML format and the PDF output format do not always properly display fonts. To resolve this, add cuba/fonts subdirectory with required .ttf fonts to the Middleware configuration directory (tomcat/conf/app-core in default deployment configuration). Additionally, you can use existing operating system fonts by specifying their path in the reporting.fontsDir application property.
In order to resolve the fonts issue on a Ubuntu server, you should do the following:
-
Install the
ttf-mscorefonts-installerpackage:$ sudo apt-get install ttf-mscorefonts-installer
-
Set the reporting.fontsDir application property:
reporting.fontsDir = /usr/share/fonts/truetype/msttcorefonts
-
Explicitly specify fonts in HTML templates, for example:
<html>
<head>
    <style type="text/css">
 * { font-family: Times New Roman; }
    </style>
Another thing to mention is parsing of special characters. To avoid errors when converting HTML to PDF, it is recommended to wrap your fields in <![CDATA[ ]]> construction in your HTML template file:
<tr>
        <td> <![CDATA[${(row.fields('book_name'))!?string!}]]> </td>
        <td> <![CDATA[${(row.fields('author'))!?string!}]]> </td>
</tr>
1.2.4. Class-Defined Template
Class-defined templates are used when it is too difficult or impossible to select data using SQL, JPQL or Groovy. They are used, for example, when the report is a result of combining several other reports.
The class defining the template must implement the com.haulmont.yarg.formatters.CustomReport interface. In the class, you need to define the createReport() method, which returns an array of bytes and takes the following input parameters:
-
report- report descriptor of thecom.haulmont.yarg.structure.Reporttype. -
rootBand- root band data of thecom.haulmont.yarg.structure.BandDatatype. -
params- map of external report parameters.
Below is an example of a simple class-defined template. It creates an HTML document showing the name of a book selected as report parameter:
package com.sample.library.report;

import com.haulmont.yarg.formatters.CustomReport;
import com.haulmont.yarg.structure.BandData;
import com.haulmont.yarg.structure.Report;
import com.sample.library.entity.Book;
import java.util.Map;

public class BookReport implements CustomReport {
    @Override
    public byte[] createReport(Report report, BandData rootBand, Map<String, Object> params) {
        Book book = (Book) params.get("book");
        String html = "<html><body>";
        html += "<p>Name: " + book.getName() + "</p>";
        html += "</body></html>";
        return html.getBytes();
    }
}
1.2.5. Chart Template
Chart output type is available if the application project includes the charts component. Resulting chart is displayed in the Reports → Show Charts screen of your web application.
Two types of diagrams are supported: Pie chart and Serial chart. Each type has its own set of parameters.
Pie chart:
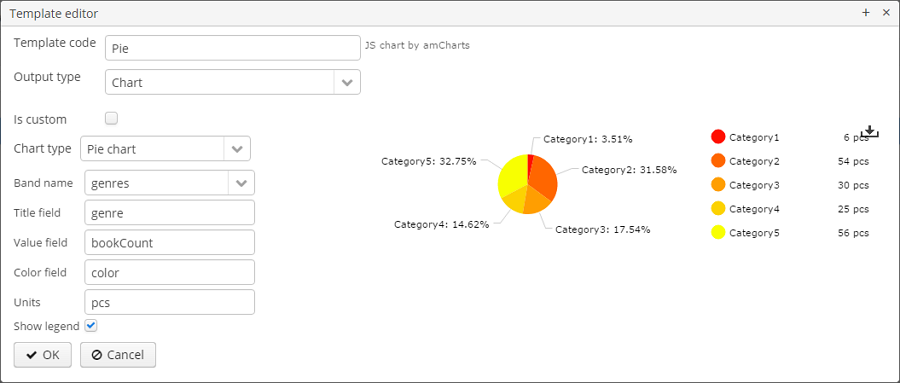
-
Band name - a band providing data for the chart.
-
Title field - a field from which segment names will be taken.
-
Value field - a field from which segment values will be taken.
-
Color field - a field from which segment colors will be taken. The color value should be specified in the web format. If not defined, colours will be chosen automatically.
-
Units - this text will be added to legend values.
Serial chart:
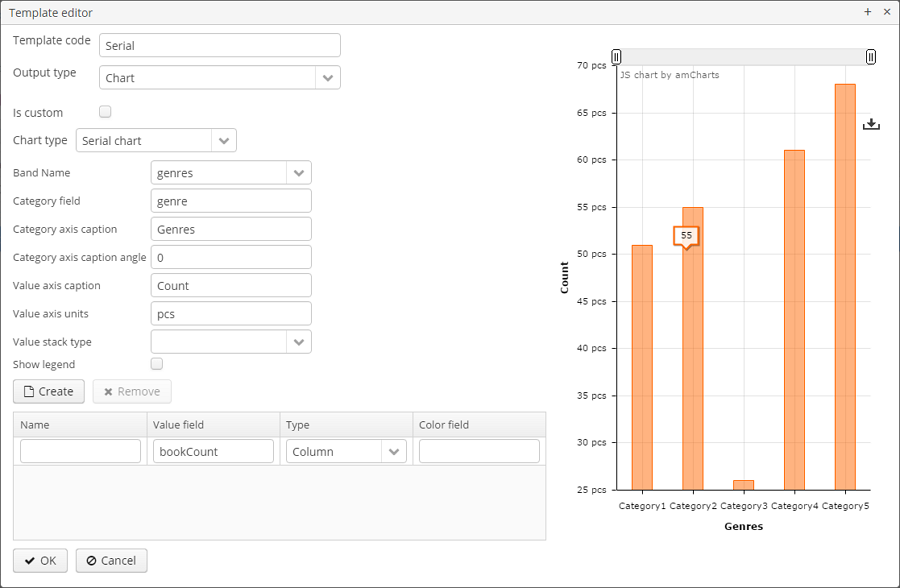
-
Band name - a band providing data for the chart.
-
Category field - a field from which category names will be taken.
-
Category axis caption - a caption for the horizontal axis.
-
Value axis caption - a caption for the vertical axis.
-
Value axis units - this text will be added to values.
At least one row definition must be added for the serial chart:
-
Value field - a field from which row values will be taken.
-
Type - row display type.
-
Color field - a field from which segment colors will be taken. The color value should be specified in the web format. If not defined, colours will be chosen automatically.
1.2.6. Output format compliance matrix
| Template / Output | XLSX | XLS | DOCX | DOC | HTML | Chart | |
|---|---|---|---|---|---|---|---|
XLSX |
+ |
+ 1 |
|||||
XLS |
+ |
+ 1 |
|||||
DOCX |
+ |
+ 2 |
+ |
||||
DOC |
+ |
+ 1 |
|||||
HTML |
+ |
+ |
|||||
Chart |
+ |
1 - OpenOffice must be installed for output.
2 - depending on the reporting.openoffice.docx.useOfficeForPdfConversion application property, the output can be performed with or without OpenOffice. In the latter case, you need to provide required fonts, as described in Converting HTML to PDF.
1.3. External Report Parameters
External parameters are passed from the outside when running a report and can be used as conditions in datasets. All external parameters become fields for each report band, so you can use them directly in the template as dataset fields. If any dataset contains field with the same name, it overrides the external parameter in the corresponding band and the report uses the dataset field value.
You can describe the external parameters in the Parameters and Formats tab of the report editor. The form for adding parameters is provided below:
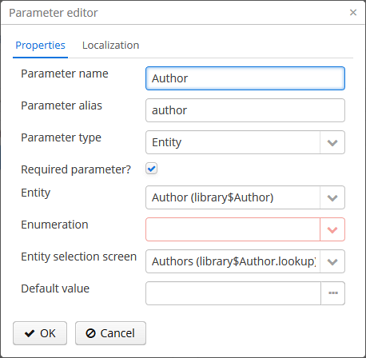
Properties tab:
-
Parameter name - parameter name, as it will appear in the parameter input form when running the report.
-
Parameter alias - parameter alias used to access it in datasets.
-
Parameter type - parameter type.
-
Required parameter - flag determining if the parameter is mandatory.
-
Entity - if the Entity or List of entities of entities parameter type is selected, then you need to select the entity type in this field.
-
Enumeration - if the Enumeration parameter type is specified, then you need to select the enumeration type in this field.
-
Entity selection screen - optional screen identifier, which will be used to select entity instances. If the screen is not specified, selection will be made from a special screen generic for all entities.
In the Localization tab, you can define the parameter name for different locales. In order to do this, you should enter the locale_name = parameter_name pairs, for example:
ru = Книга1.4. Field Value Formats
You can specify the formatting for any field output by the report in the Parameters and Formats tab of the report editor. Below is the form to add a format:
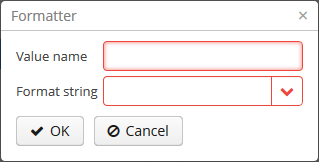
-
Value name - report field name with the band prefix, for example
Book.name. -
Format string - field format. For number values, you must specify the format according to the
java.text.DecimalFormatrules, for dates -java.text.SimpleDateFormat.
With the help of formats, it is possible to insert images and HTML blocks into the document.
-
In order to insert an image, you must specify the image URL as the field value and the format string must be as follows:
${image:<Width>x<Height>}, for example${image:200x300}. -
In order to insert an HTML block, you should return an HTML markup in the field, and select
${html}as the format string. In the output value, you may omit top-level tags up to<body>inclusive. If necessary, all missing top-level tags will be added automatically. All blocks should be encoded withUTF-8. CSS and thestyleattribute are not supported.
You can specify your own custom formats as well. To do this, type the new value in the field without opening the dropdown and press Enter. You can also choose any format from the dropdown, edit its name in the field and press Enter. Custom format will be saved in both cases.
1.5. Report Access Rights
You can define user rights to access the report as well as report availability in certain application screens in the Roles and Screens tab of the report editor.
If the report roles list contains at least one role, the report will be available only to users with this role. If no roles are specified, the report is available to everyone.
The screens list allows to specify, which screens the report will be available in when invoking RunReportAction, TablePrintFormAction or EditorPrintFormAction actions. If no screen is specified, the report will be available from any screen.
1.6. Report Name Localization
You can localize the report name - show the name in the language, which the user is logged in with, in the report list. In order to do this, you need to go to the Localization tab and enter pairs, locale_name = report_name, as separate lines in the text field, for example:
en = Books by author
ru = Книги по автору
2. Running Reports
This section describes how to run created reports.
2.1. Running from the Generic Reports Browser
The easiest way to run reports is from the generic browser, which is available in the Reports → Run Reports screen. The user must have the right to access this screen. The list will contain all reports that are available to the user in accordance with his role. If the report has external parameters, they will be requested in a special form when running the report.
2.2. Running Reports from Screens
You can run reports from arbitrary screens using special actions and associated buttons or component context menu items. In such case report availability in this screen will also be checked in addition to user role.
Action types and examples of their use are provided below.
-
com.haulmont.reports.gui.actions.RunReportAction- action showing the list of all available reports. When a user selects a report from the list, the parameters input form is displayed (if any were defined) and the report is run.Below is an example of using the action together with a button declared in the screen XML descriptor:
-
XML-descriptor
<layout> <table id="bookTable"> ... <buttonsPanel id="buttonsPanel"> ... <button id="reportButton" icon="icons/reports-print.png"/> </buttonsPanel> </table> -
Controller
@Inject private Button reportButton; @Override public void init(Map<String, Object> params) { reportButton.setAction(new RunReportAction("report")); } -
messages.properties
report = Report
-
-
com.haulmont.reports.gui.actions.TablePrintFormAction- an action associated with a table displaying a list of entity instances. The action only selects reports having an external parameter of the Entity or the List of entities type and where the parameter entity type matches the entity type displayed by the table. If only one report is available as a result of selection, it is invoked immediately. If several reports are available, their list is offered to the user for selection.The external parameter value is passed to the report using the following rules:
-
If the parameter has the List of entities type, the list of instances currently selected in the table is passed into it.
-
If the parameter has the Entity type, and the table has a single instance selected (one row is highlighted), then this instance is passed into the report.
-
If the parameter is of the Entity type, and the table has several rows selected, then the report runs several times according to the number of selected instances. After execution, the user gets a single ZIP archive containing all generated reports.
Below is an example of using the action in a button and the table context menu:
-
XML descriptor
<layout> <table id="bookTable"> ... <buttonsPanel id="buttonsPanel"> ... <button id="reportButton" icon="icons/reports-print.png"/> </buttonsPanel> </table> -
Controller
@Inject private Button reportButton; @Inject private Table bookTable; @Override public void init(Map<String, Object> params) { TablePrintFormAction action = new TablePrintFormAction("report", bookTable); bookTable.addAction(action); reportButton.setAction(action); } -
messages.properties
report = Report
-
-
com.haulmont.reports.gui.actions.EditorPrintFormActionan action associated with an entity editor screen. The action only selects reports having an external parameter of the Entity or the List of entities type and where the parameter entity type matches the edited entity type. If only one report is available as a result of selection, it is invoked immediately. If several reports are available, their list is offered to user for selection.The external parameter value - edited entity instance - is passed into the report. If the parameter has the List of entities type, then a list containing a single item is passed.
Below is an example of using the action in a button located near the standard OK and Cancel buttons:
-
XML descriptor
<layout expand="windowActionsBox"> ... <hbox id="windowActionsBox" spacing="true"> <iframe id="windowActions" screen="editWindowActions"/> <button id="reportButton"/> </hbox> </layout> -
Controller
@Inject private Button reportButton; @Override public void init(Map<String, Object> params) { reportButton.setAction(new EditorPrintFormAction("report", this, null)); } -
messages.properties
report = Report
-
3. Sample Report
In this chapter we will consider the structure of one of reports from the sample Library application, which source code is available at https://github.com/cuba-platform/sample-library.
To use reports in your project, activate the reports item in the App components list on the Project properties page of CUBA Studio.
Open the Reports → Reports screen and click on the Import button to import the report. Choose Reports.zip in the project root directory. Two reports will appear in the table, one of them will be Books by author. This report displays the list of book publications for selected author; books will be grouped by book name and publisher. The output format is XLS.
-
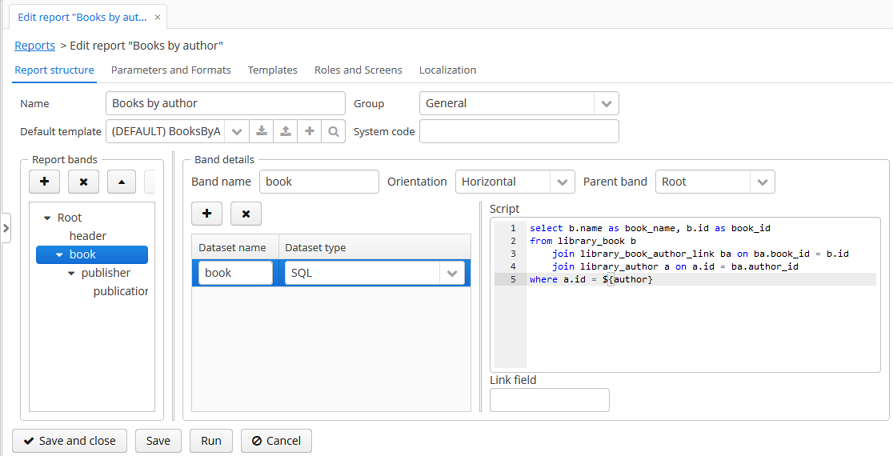
Let us consider report bands.
-
header band - report header. It contains the dataset with the Groovy script which outputs the report external parameters values:
[['authorName' : (params['author'].firstName + ' ' + params['author'].lastName)]]-
The book band outputs the list of books by running the following SQL query:
select b.name as book_name, b.id as book_id
from library_book b
    join library_book_author_link ba on ba.book_id = b.id
    join library_author a on a.id = ba.author_id
where a.id = ${author}
This query uses the external report parameter - author. The parameter has the Entity type, however in SQL queries you can compare it directly with entity identifier fields; the conversion will be done automatically.
-
The publisher band, which is a child band of book, outputs the book publishers by running the following SQL query:
select p.name as publisher, bp.year, p.id as publisher_id
from library_book_publication bp
    join library_publisher p on p.id = bp.publisher_id
where bp.book_id = ${book.book_id}
This query uses the parent band field
book_idas a parameter. This provides dependency between the parent and child bands.-
The publication band, which is a child of the publisher band, outputs the book publications by running the following SQL query:
select ld.name as department, count(bi.id) as amount
from library_book_instance bi
    join library_book_publication bp on bp.id = bi.book_publication_id
    join library_library_department ld on ld.id = bi.library_department_id
where bp.publisher_id = ${publisher.publisher_id} and bp.book_id = ${book.book_id}
group by ld.name
This query uses both parent bands fields as parameters -
book_idandpublisher_id. -
-
Report parameters.
The Parameters and Formats tab contains one declared report external parameter - Author:
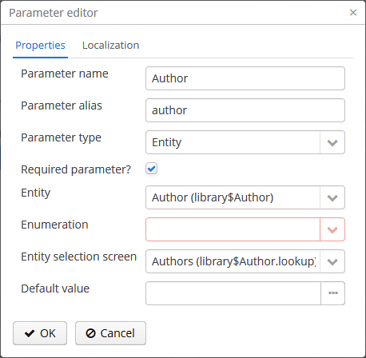
When running the report, the user will have to enter this parameter. The author selection will be performed via the
library$Author.lookupscreen, available in the application. -
Report templates.
The Templates tab contains a single defined XLS template, loaded from
BooksByAuthor.xls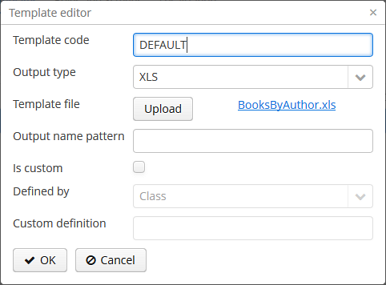
-
Report Name Localization.
The Localization tab contains the report name for the Russian locale:
ru = Книги по автору
You can run report from the generic browser in the Reports → Run Reports screen.
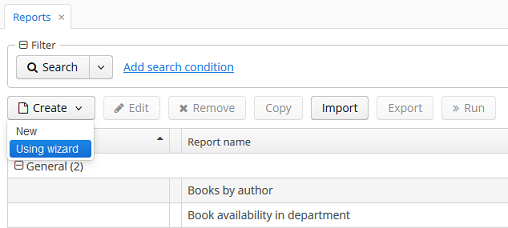
4. Reports Wizard
Reports wizard is a visual tool for quick report creation including both data structure and template design. Click Create → Using wizard in the Reports screen to run the wizard.
Three types of reports can be created using the wizard:
-
Report for a single entity.
-
Report for a list of given entities.
-
Report for a list of entities filtered by query.
Report design is a three steps process:
-
Creating a data structure of a report.
-
Editing of report regions.
-
Saving the report.
The created report can be modified in the usual manner using the report editor and run through the generic report browser, or using TablePrintFormAction and EditorPrintFormAction actions.
The use cases below illustrate how to use the wizard. All the examples are based on the sample Library application which is available in the CUBA Studio samples. The Library application or any other sample CUBA application can be downloaded by clicking the Samples button in the project selection window.
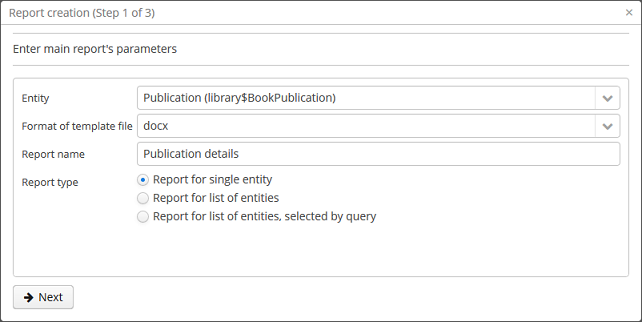
4.1. Report for a Single Entity
Let us assume that we want to get an information about the particular publication of a book, i.e. an instance of library$BookPublication entity.
First, run the reports wizard and specify the report details:
-
Entity - entity to be shown in the report -
library$BookPublication. -
Format of template file - report template format that defines the format of the output - DOCX. Note that XSLX and PDF formats are also available.
-
Report name -
'Publication details'.
Next, specify the report type: Report for single entity.
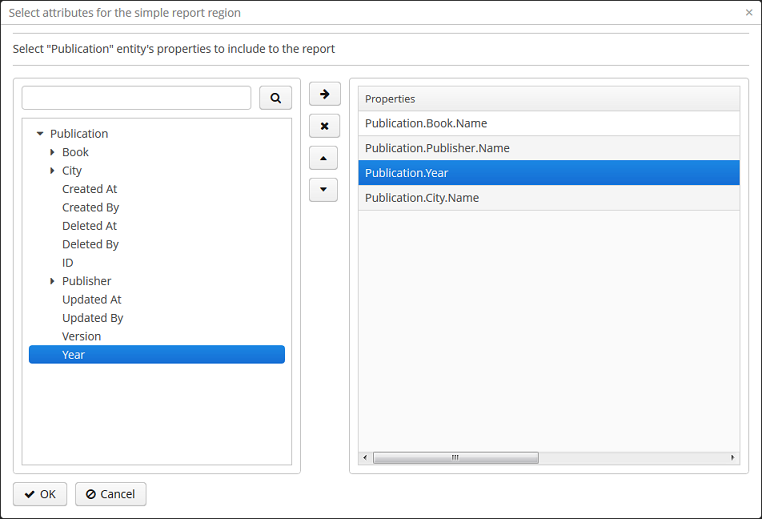
Then click Next button; the Select attributes for the simple report region window appears. Specify the attributes of the BookPublication entity and linked entities that should be reflected in the report (Publication.Book.Name, Publication.Publisher.Name, Publication.Year and Publication.City.Name). In order to do this, select them in the left column and move them to the right clicking ![]() or by double-click.
or by double-click.
The order of the attributes in the report will correspond the order specified in the right hand side list. To change the display order, move the attributes up and down by clicking  /
/ .
.
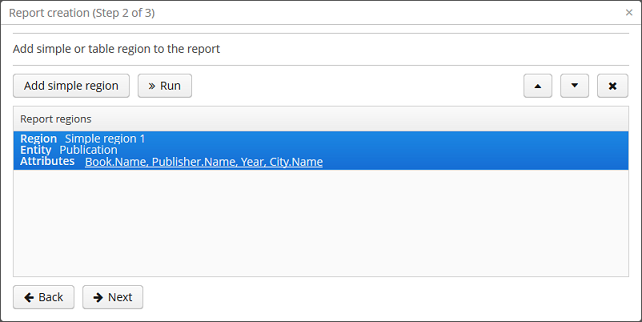
Click ОК to move to the second stage - report regions editing.
The appeared screen contains a list of named regions - bands that display related data. The wizard enables adding several plain-text regions to the template in order to display different data sets.
A set of entity attributes loaded to a particular region can be modified by clicking the link represented as the list of the selected attributes. You can also add a new region by clicking Add simple region.
If the entity contains collection attributes, Add tabulated region, button will appear. It enables adding a region for tabular data display.
In both cases, the selection dialog will appear with a list of attributes of the library$BookPublication entity, allowing you to add or remove attributes from the set.
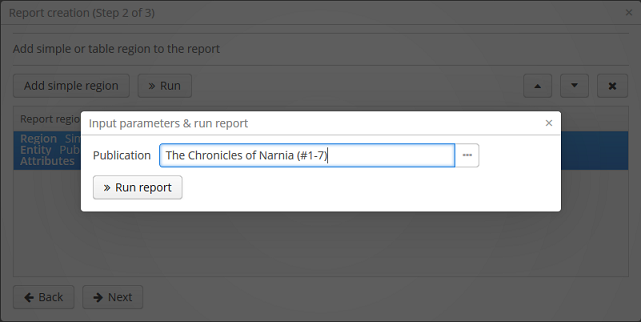
At this stage, we already can run the report and see how the report looks. Click Run button, pick the instance of library$BookPublication and see the result.
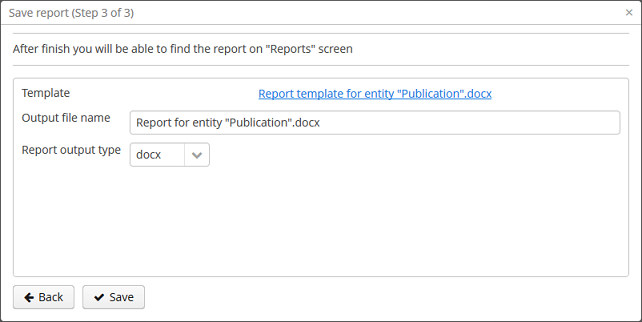
When all report regions are configured you can move on to the third stage: saving the report. At this point, you can view the complete report template, or change the name and format of the output file to any of three available types: DOCX, HTML, PDF.
After clicking the Save button, the standard report editor comes up. Now you can fine-tune the report in the usual manner. Once editing is complete, click Save and close in the report editor.
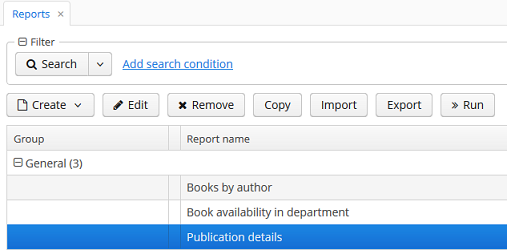
The report is now added to the General reports group in the reports browser, where you can run it from by clicking the Run buttons.
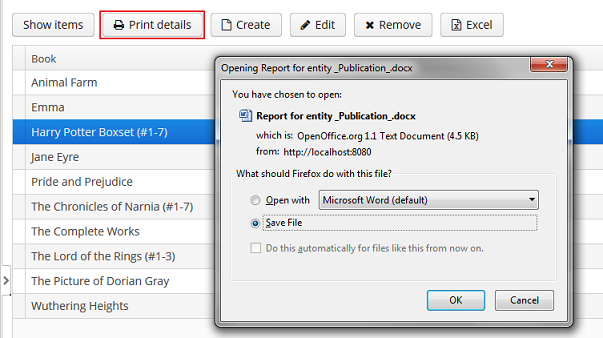
Additionally, we can enable the report run on the publications browser. In order to do this, we want to add the bookpublication-browse.xml button to the Print details screen descriptor:
<groupTable id="bookPublicationTable"
    ...
    <buttonsPanel>
        ...
        <button id="printDetails"
        caption="msg://printDetails"/>
Then we need to implement TablePrintFormAction in the controller:
@Inject
private Button printDetails;

@Override
public void init(Map<String, Object> params) {
    TablePrintFormAction action = new TablePrintFormAction("report", bookPublicationTable);
          bookPublicationTable.addAction(action);
          printDetails.setAction(action);
    }
Now you can run the report for any publication by selecting it in the table and simply pressing the Print details button.
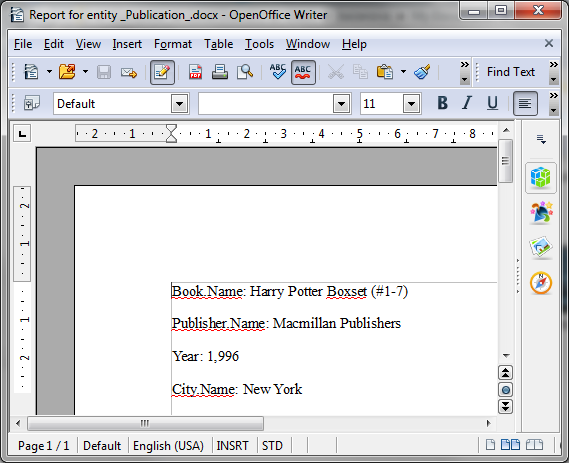
The output is as follows:
4.2. Report for a List of Entities
Reports wizard allows you to create two types of reports for a list of entity instances:
-
report for manually selected instances of a particular entity
-
report for entity instances filtered by a certain request.
Let us have a look at the first report type. Let us assume we want to obtain a list of all book instances in the library (library$BookInstance entity) with titles and library departments they belong to.
At the first stage, we specify the report details:
-
Entity - report entity -
library$BookInstance. -
Format of template file - output format - XSLX.
-
Report name - report name -
'Book items location'.
After that, select the type of the report (Report for list of entities) and click Next.
As per the task, we select BookItem.Publication.Book.Name and BookItem.LibraryDepartment.Name in the attributes selection window.
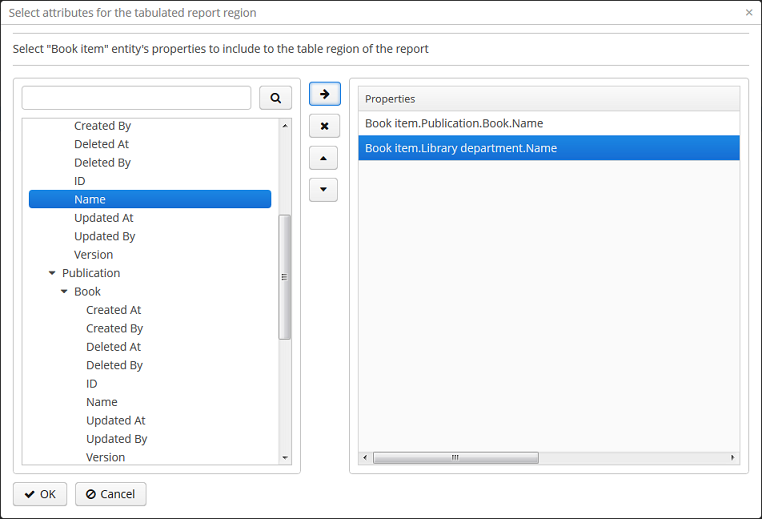
Click ОК and move to the second stage of report regions editing.
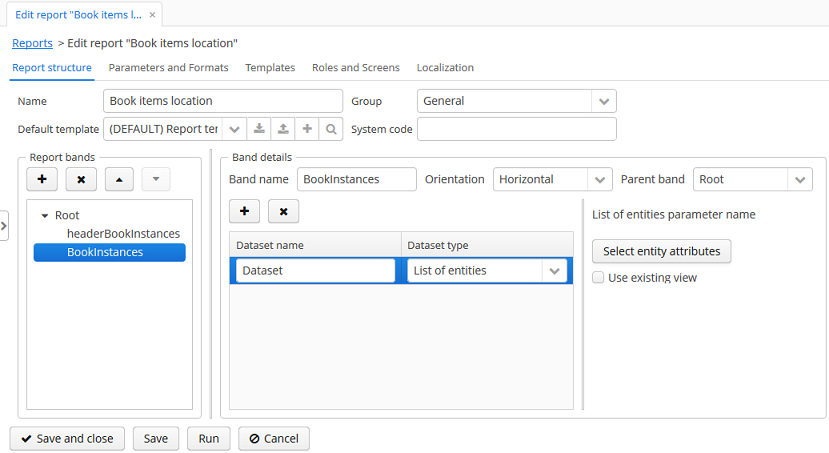
The report template for a list of entities restricted to have only one region that displays data in tabular form. Adding new regions is not allowed, but you can edit an existing set of data by clicking on the link with the list of attributes, or remove an existing region and recreate it.
In this case, we do not need to make any changes. Click Next → Save to save the report. The report looks as follows in the report editor:
Once the report is saved, you can run it from the reports browser.
In addition, we can add a button to run the report from the book items browser, which can be opened by clicking the Show items button in the publications browser. In order to do this, we will set the multiselect attribute for the book instances table to true to be able to specify a set of records for the report and then add the source code of the button:
      <table id="bookInstanceTable"
             multiselect="true">
             ...
                  <buttonsPanel>
                  ...
                      <button id="printList"
                      caption="msg://printList"/>
After that, inject the Button component in the screen controller:
@Inject
private Button printList;
Next, add the following implementation within the overridden init() method:
TablePrintFormAction action = new TablePrintFormAction("report", bookInstanceTable);
    bookInstanceTable.addAction(action);
    printList.setAction(action);
Now the report can be run from the book items browser by selecting items for the report in the table and pressing the Print list button. Print selected option exports the selected items, Print all option prints all instances selected by the current filter.
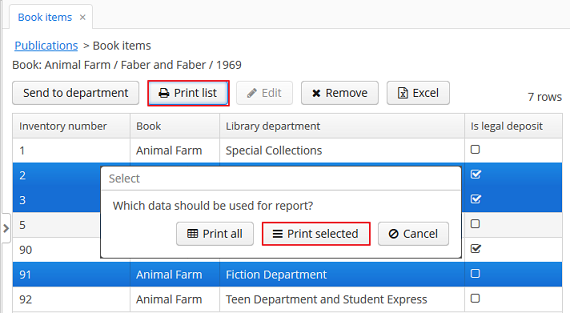
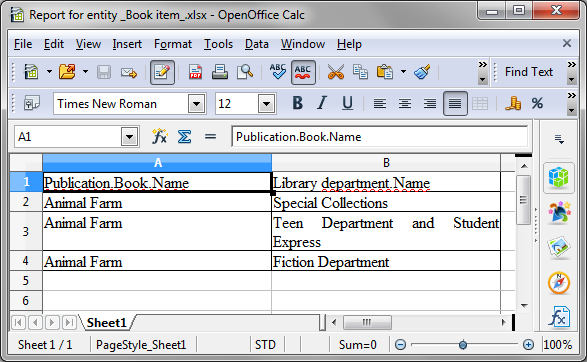
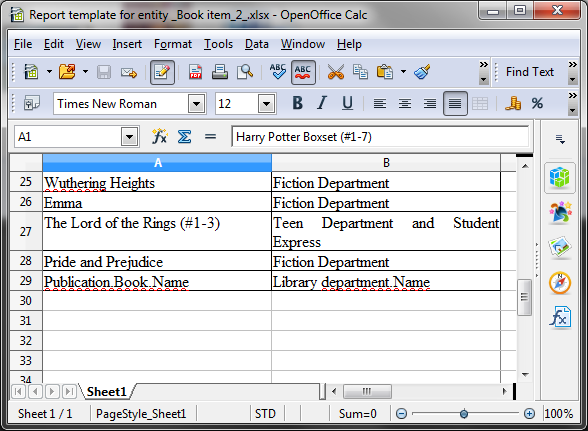
The output is as follows:
4.3. Report for a List of Entities Filtered by Query
Now let us have a look at the second Report for a List of Entities for a list of entities filtered by query. To demonstrate the use case of this report type use we will being complications to our task. As before the report should contain a list of books (with their titles and department names), but only added after a certain date.
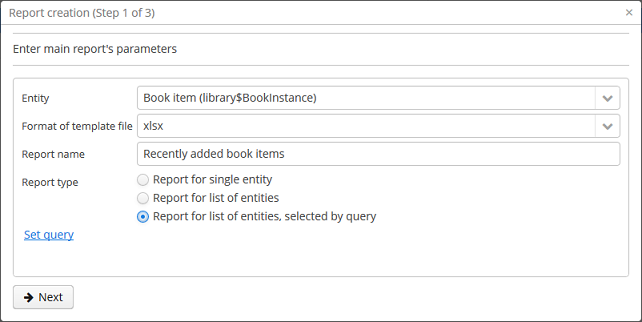
Let us set the details of the report like in the previous case:
-
Entity - report entity -
library$BookInstance. -
Format of template file - output file format - XSLX.
-
Report name -
'Recently added book items'.
Then select the Report for list of entities, selected by query report type.

The selected report type enables us to select the list of entities that match the specified conditions. In order to set the query, click Set query link below.
The Define query window appears. As you can see the window is similar to the generic filter window. Here you specify conditions, combine them into AND/OR groups and configure their settings.
In order to add new query conditions, click Add. Select Created at attribute in the appeared window. Now the attribute is added to the query conditions tree and the right hand side panel displays its properties. Select an operator (>=).
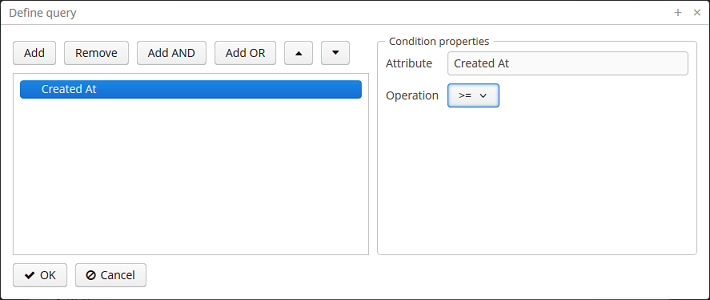
After saving the query, click Next and move to library$BookInstance attributes selection. We move BookItem.Publication.Book.Name and BookItem.LibraryDepartment.Name attributes to the right. Click OK to move on to accomplish the first stage.
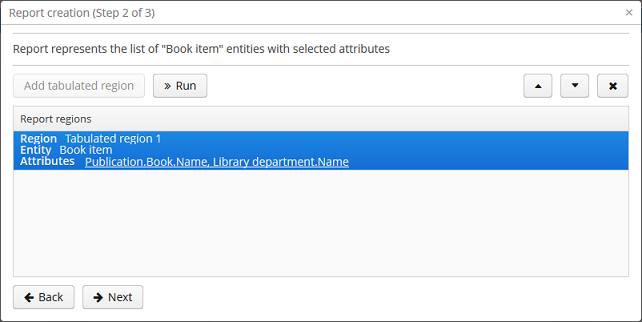
Press Next → Save to save the report. The report will look as follows:
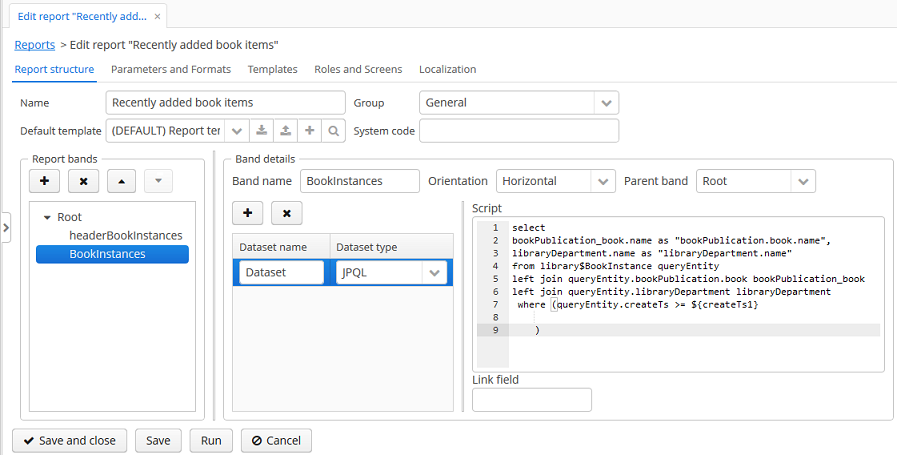
The editor allows making the report structure more sophisticated by adding new bands and data sets, as well as configuring the report template design, localization, access rights.
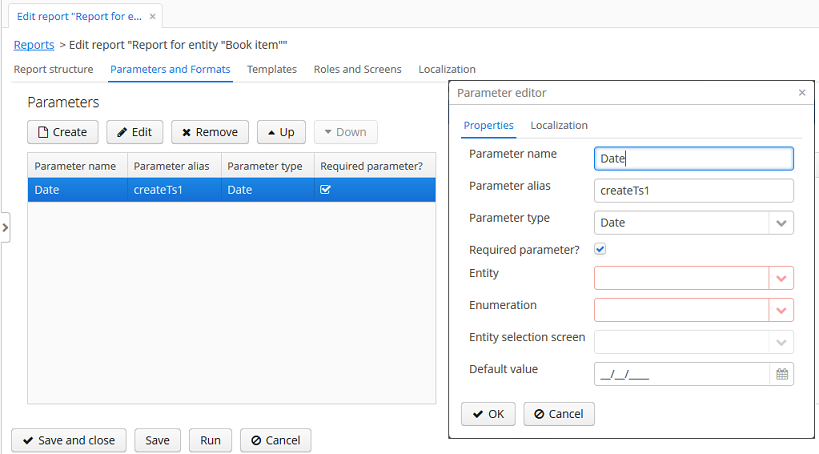
For instance, we can switch to Parameters and Values tab and modify the query parameter in the Parameters list: Date instead of the standard CreateTs1.
After all, let us add the Report button that runs the report right from the library departments browser.
In order to do this, we need to define a button in the librarydepartment-browse.xml screen descriptor:
<table id="libraryDepartmentTable"
    ...
    <buttonsPanel id="buttonsPanel">
        ...
        <button id="reportBtn"
         caption="msg://reportBtn"/>
     </buttonsPanel>
</table>
After that, inject the button in the screen controller:
@Inject
private Button reportBtn;
and assign RunReportAction to the button in the overridden init() method:
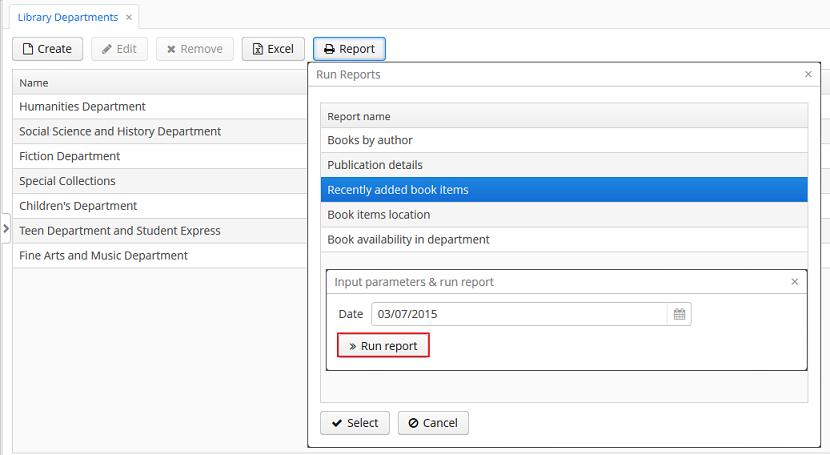
reportBtn.setAction(new RunReportAction("report"));The Report button will appear in the library departments browser, displaying the list of all reports available in the system in one click. In order to run the report, select Recently added book items in the list, specify the date and click Run report.
The output is as follows:
Appendix A: Installing and Configuring OpenOffice
The report generator uses the OpenOffice / LibreOffice package to output reports in PDF and DOC formats. The installation to the computer containing the application server and configuration of this package is described below.
Installing and Configuring OpenOffice for Microsoft Windows
-
Download the application at http://openoffice.org.
-
Install the application.
-
In the reporting.openoffice.path application property, specify the path to OpenOffice.org, for example:
reporting.openoffice.path = C:/Program Files (x86)/OpenOffice.org 3/programInstalling and Configuring LibreOffice on Ubuntu Server
-
Install the
libreofficepackage, for example, by running the following command:
$ sudo apt-get install libreoffice
-
In the reporting.openoffice.path application property, specify the path to LibreOffice:
reporting.openoffice.path = /usr/lib/libreoffice/program-
If the server does not have window interface installed, LibreOffice will start with the error,
Caused by: java.awt.HeadlessException: No X11 DISPLAY variable was set, but this program performed an operation which requires it, or will simply terminate without error messages. To resolve this, set the reporting.displayDeviceUnavailable application property:
reporting.displayDeviceUnavailable = true-
You can run the following command to diagnose errors when starting LibreOffice:
$ strace -e trace=signal /usr/lib/libreoffice/program/soffice.bin --headless --accept="socket,host=localhost,port=8100;urp" --nologo --nolockcheck
Installing and Configuring LibreOffice for Mac OS X
-
Download the application at https://www.libreoffice.org/get-help/install-howto/os-x/.
-
Install the application.
-
In the reporting.openoffice.path application property, specify the path to LibreOffice.app, for example:
reporting.openoffice.path = /Applications/LibreOffice.appAppendix B: Application Properties
This section describes the application properties related to the report generator in the alphabetical order.
- reporting.fontsDir
-
Path to the fonts directory for converting HTML to PDF.
For example:
reporting.fontsDir = C:/Windows/Fonts.Used in the Middleware block.
- reporting.openoffice.docx.useOfficeForPdfConversion
-
Turns on using OpenOffice to convert the report having DOCX template to PDF, which significantly increases the conversion accuracy.
Default value:
falseUsed in the Middleware block.
- reporting.openoffice.path
-
Sets the path to OpenOffice.
Default value:
/Used in the Middleware block.
- reporting.putEmptyRowIfNoDataSelected
-
Sets the mode when the bands which datasets have returned no records are still displayed once.
Default value:
trueUsed in the Middleware block.