1. Overview
The add-on gives you an easy way to enrich your application with visual representation and intuitive manipulation for spatial data. With this add-on you are free to use a preferable map provider that meets your needs as it is compatible with the Web Map Service protocol as well as XYZ tiles services.
The component integrates spatial types (point, polyline, polygon) from JTS Topology Suite (JTS) — the most popular Java library for working with spatial data. The add-on provides all the required features to build a comprehensive geographical information system on CUBA.
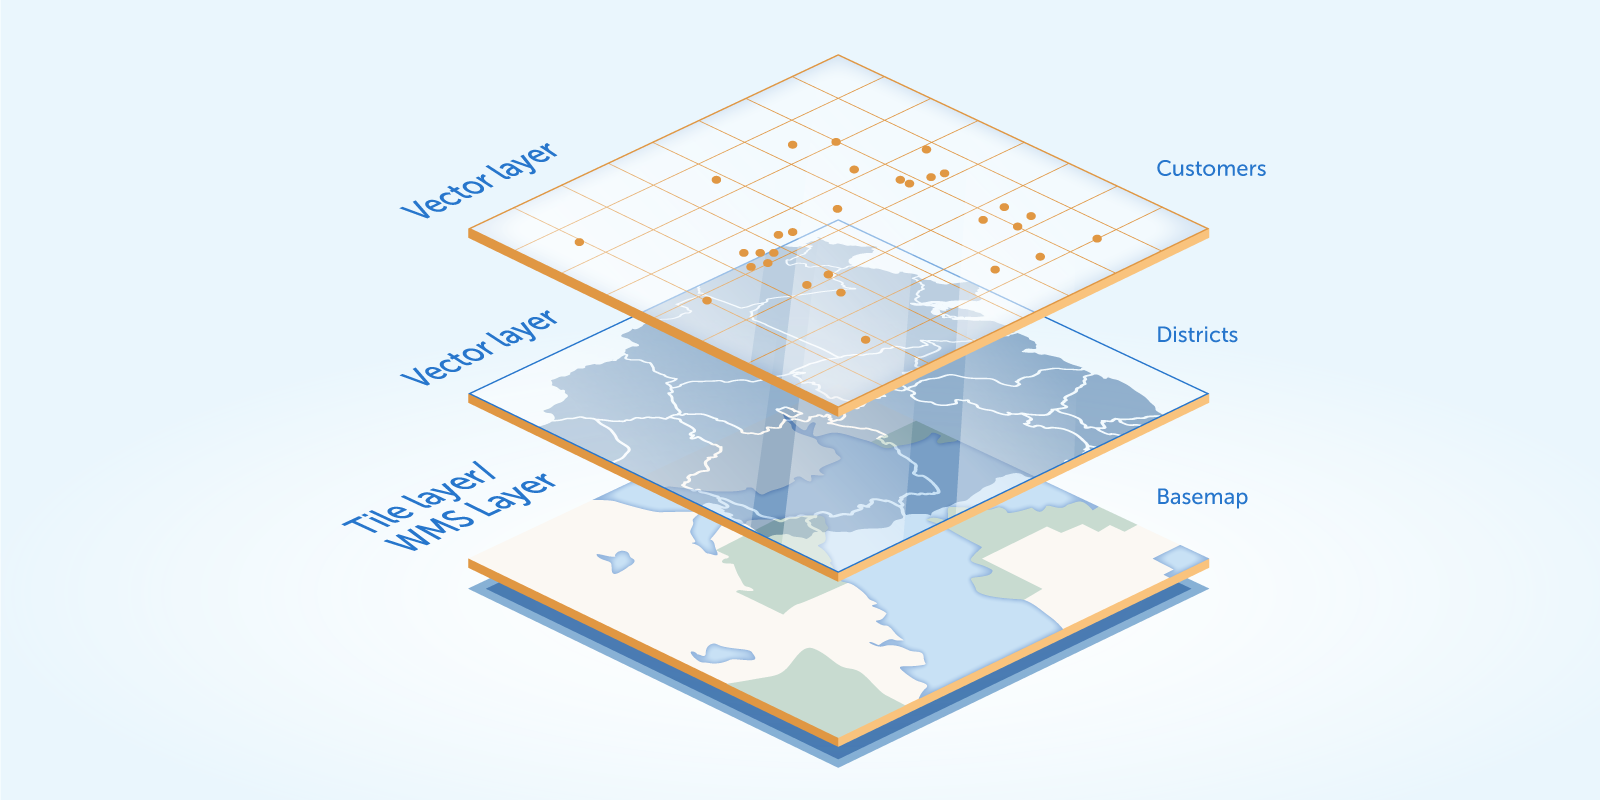
The add-on supports the traditional multi-layer structure, so it gives full freedom to create well-structured maps of any content.
Key features:
-
Introduces a visual component for Generic UI with rich and clear API.
-
Supports drawing and interactive editing of geo-entities — entities with geometry attributes.
-
Compatible with the Web Map Service protocol as well as XYZ tile services.
-
Provides features for geoanalysis: heatmaps and clustering.
See sample application using this component.
Also, see the video tutorial on the CUBA YouTube channel.
2. Release Notes
Release 1.3.2
-
Update dependencies 3307
Release 1.3.1
-
Added
GeoObjectClickEventtoVectorLayer. -
Added
MouseEventDetailsto click events. Can be useful, for example, to receive double-click events.
Release 1.3.0
-
Added HeatMap layer support. Setting a heat map has become easier and can be done in XML descriptor:
<maps:heatmap id="heatmapLayer" dataContainer="ordersDc" intensityProperty="amount" maximumIntensity="100" minOpacity="0.4"/> -
Added Image layer support. Allows you to display an image inside specific borders on a map:
<maps:image id="imageLayer" image="url:https://www.cuba-platform.com/uploads/a07f0d67b82f44329b5b3cef5e8bfa29.jpg" topLeft="-37.88085, 53.54030" bottomRight="-11.10742, 44.65302" opacity="0.5"/> -
Added some useful methods to GeoMap API:
-
List<Layer> getLayers()— returns a list of layers currently added to the map. -
Point getCenter()— returns current geographic center of the map. -
double getZoomLevel()— returns current map zoom level. -
void zoomToBounds(Point topLeft, Point bottomRight)— sets a map view that contains the given geographical bounds with the maximum zoom level possible. -
void zoomToGeometry(Geometry geometry)— sets a map view that contains envelope of the given geometry with the maximum zoom level possible.
-
Release 1.2.0
-
Optimized vector layers refreshing.
-
Added tooltips support. Tooltips are small text boxes that generally appear on hovering over geometries, but can be configured as permanent to be used as text labels picked to geometries.
-
Added new point icon type:
DivPointIcon- a fully custom lightweight icon for points that uses a<div>element instead of an image. May be useful to display text label instead of the default point marker. -
Added possibility to open pop-up windows and tooltips programmatically.
-
Fixed small bugs.
3. Installation
3.1. Installation of Trial Version
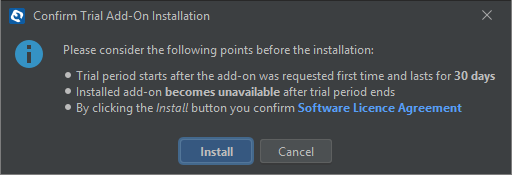
If you do not have a subscription for the add-on, you can install a trial version that is available for 30 days.
-
Launch CUBA Studio. You can download it from the CUBA website. Please ensure that you have Studio version 13.2 or newer.
-
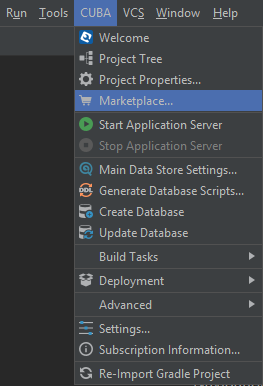
Go to CUBA → Marketplace in the main menu.
-
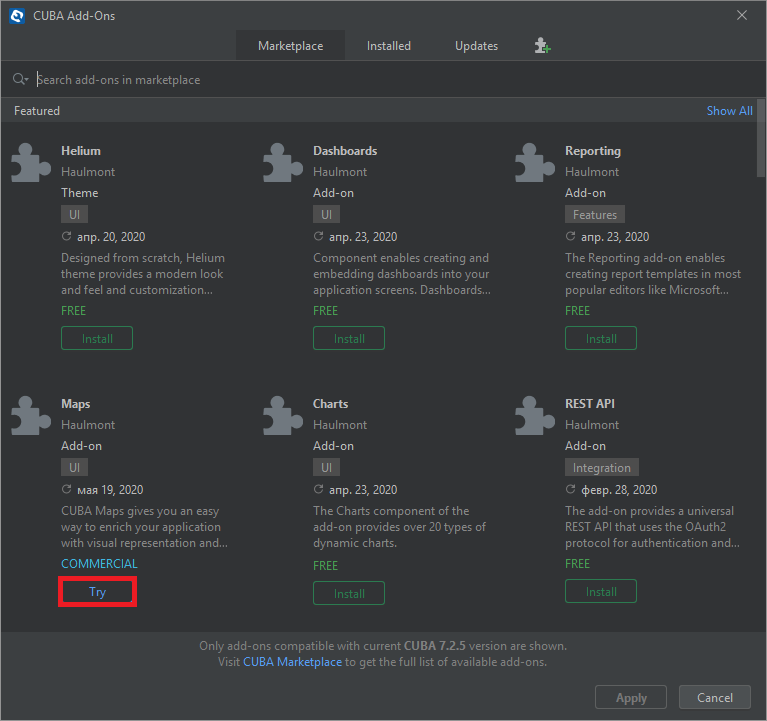
Find the required add-on and click Try next to it.
-
If you are not signed in CUBA Studio yet, click Sign In in the appeared window.
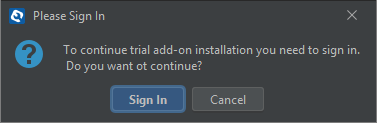
Register or log in on the website. If you were already logged in on the website, proceed to the next step.
-
Read the instructions and click Install.
-
Click Apply. A trial version of the add-on will be installed into your application.
When the trial period is expired, CUBA Studio will inform you. Keep being signed in CUBA Studio to not miss the end of the trial period.
|
Warning
|
Please pay attention that you won’t be able to run your application with the expired trial version of the add-on. |
3.2. Installation of Purchased Add-on
If you have a subscription for the add-on follow the steps below. Please ensure you have Studio version 12 or newer installed.
-
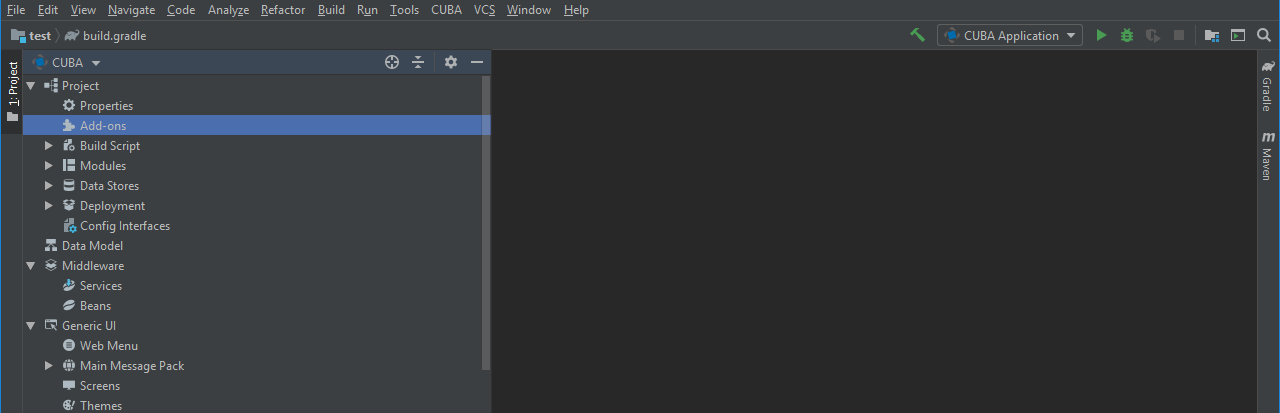
Double-click Add-ons in the CUBA project tree.
-
Select Marketplace tab and find Maps add-on.
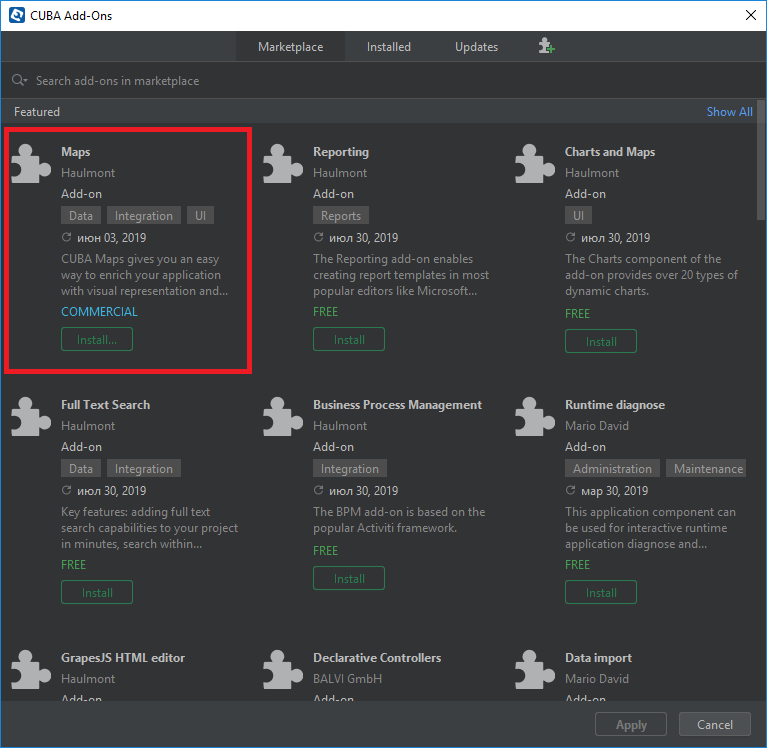
-
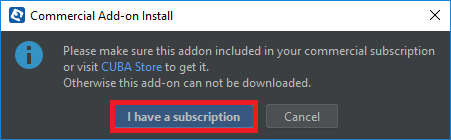
Click Install button and confirm that you have a subscription in the appeared dialog.
-
Click Apply & Close button and then Continue in the dialog.
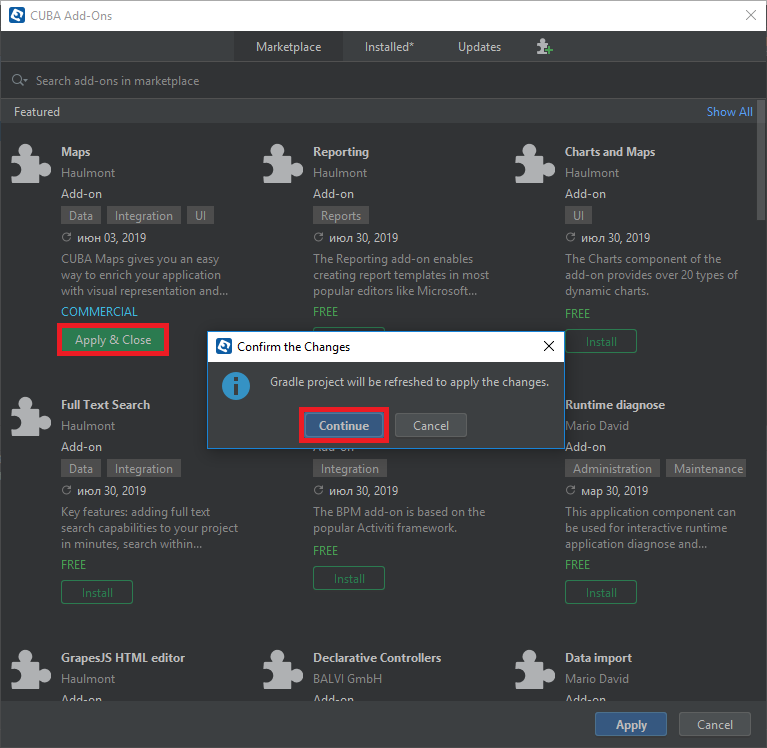
Maps add-on will be installed in your project.
3.3. Manual Installation
Use this way of installation in case you build your project from the command line or your subscription does not include Studio Premium Subscription.
Adding Premium Repository
Open build.gradle file and add one more repository:
-
If the main repository is
repo.cuba-platform.com, addhttps://repo.cuba-platform.com/content/groups/premiumbuildscript { // ... repositories { // ... maven { url 'https://repo.cuba-platform.com/content/groups/premium' credentials { username(rootProject.hasProperty('premiumRepoUser') ? rootProject['premiumRepoUser'] : System.getenv('CUBA_PREMIUM_USER')) password(rootProject.hasProperty('premiumRepoPass') ? rootProject['premiumRepoPass'] : System.getenv('CUBA_PREMIUM_PASSWORD')) } } } } -
If the main repository is Bintray, add
https://cuba-platform.bintray.com/premiumbuildscript { // ... repositories { // ... maven { url 'https://cuba-platform.bintray.com/premium' credentials { username(rootProject.hasProperty('bintrayPremiumRepoUser') ? rootProject['bintrayPremiumRepoUser'] : System.getenv('CUBA_PREMIUM_USER')) password(rootProject.hasProperty('premiumRepoPass') ? rootProject['premiumRepoPass'] : System.getenv('CUBA_PREMIUM_PASSWORD')) } } } }
|
Warning
|
Bintray artifact repository, available by the
You should use the second The official announcement: https://jfrog.com/blog/into-the-sunset-bintray-jcenter-gocenter-and-chartcenter/ |
Providing Credentials
Your license key consists of two parts: the first part before the dash is a repository user name, the part after the dash is a password. For example, if your key is 111111222222-abcdefabcdef, then the user name is 111111222222 and the password is abcdefabcdef. In case of Bintray, the user name must be followed by @cuba-platform.
You can provide the credentials in one of the following ways:
-
The recommended way is to create a
~/.gradle/gradle.propertiesfile in your user home directory and set properties in it:premiumRepoUser=111111222222 bintrayPremiumRepoUser=111111222222@cuba-platform premiumRepoPass=abcdefabcdef -
Alternatively, you can specify the credentials in the CUBA_PREMIUM_USER and CUBA_PREMIUM_PASSWORD environment variables.
-
When you run Gradle tasks from the command line, you can also pass the properties as command-line arguments with the
-Pprefix, for example:gradlew assemble -PpremiumRepoUser=111111222222 -PpremiumRepoPass=abcdefabcdef
Adding Component
-
In the
build.gradlefile specify the component artifacts in the dependencies section as follows:com.haulmont.addon.maps:maps-global:<add-on version>where
<add-on version>is compatible with the used version of the CUBA platform.Platform Version
Add-on Version
7.2.5+
1.3.1
7.2.x
1.3.0
7.1.x
1.1.0
7.0.x
1.0.0
For example:
dependencies { //... appComponent("com.haulmont.addon.maps:maps-global:1.3.1") } -
Specify the add-on identifier
com.haulmont.addon.mapsin theweb.xmlfiles of thecoreandwebmodules in theappComponentscontext parameter:<context-param> <param-name>appComponents</param-name> <param-value>com.haulmont.cuba com.haulmont.addon.maps</param-value> </context-param> -
If you run Gradle tasks from the command line run
gradlew assemble.
The add-on will be included in your project.
4. Components Compatibility
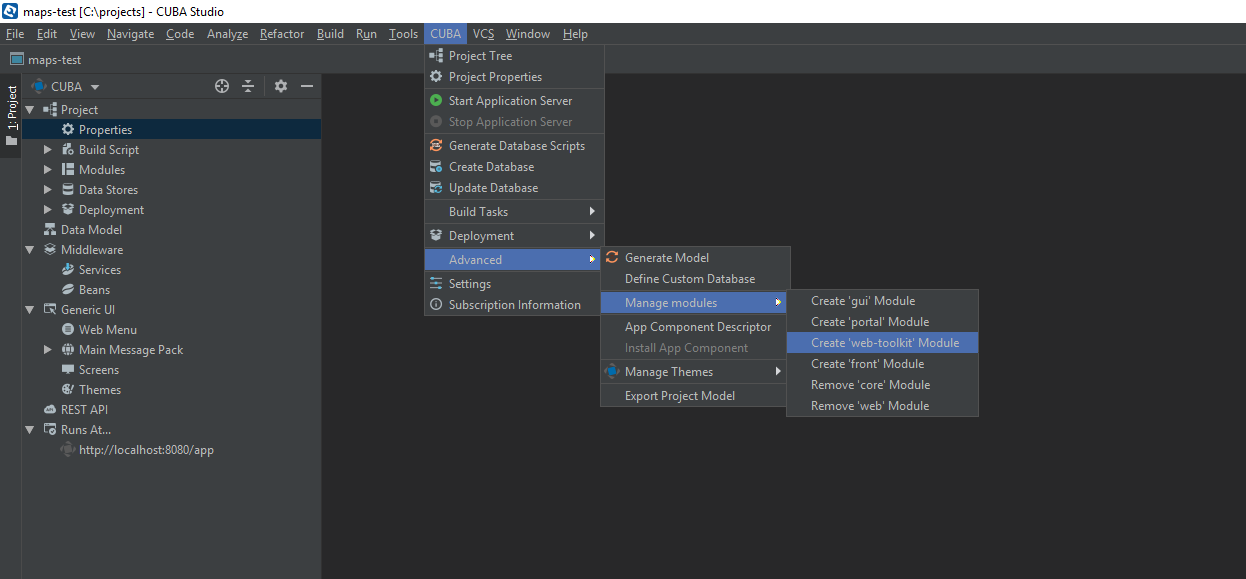
If your project uses Charts and Maps add-on (or other add-ons providing their own widgetsets), you should add web-toolkit module in your project. It is needed to integrate widgetsets from all used add-ons.
5. Usage
The add-on supports the traditional multi-layer structure commonly used in professional GIS systems. To operate with maps you need to add a visual component — GeoMap and one and more layers.
Layers are used as structural units of maps. For example, one layer may be a tiled base map, another layer may contain polygons describing districts, the third layer might consist of geographical points (locations of customers, shops and so on). By combining these layers, you build a complete map.
You are able to define the main map parameters along with the layers in the XML descriptor of the component.
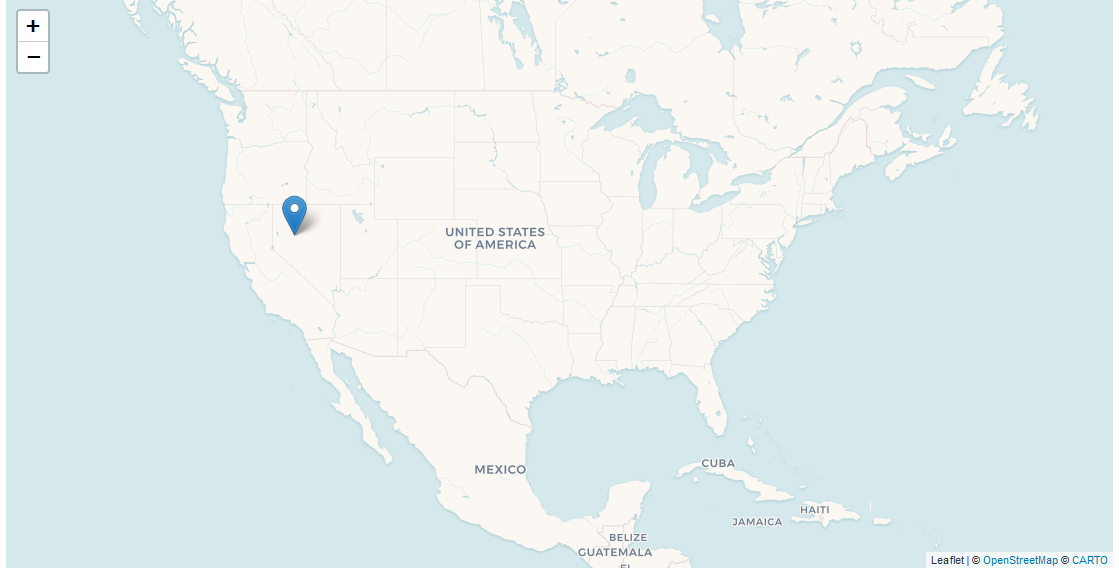
5.1. Inserting a Map into a Screen
The com.haulmont.addon.maps.web.gui.components.GeoMap UI component is used to display a map in your application screen.
To add the component, do the followings:
-
Declare the
mapsnamespace in the root element in the screen XML descriptor:xmlns:maps="http://schemas.haulmont.com/maps/0.1/ui-component.xsd" -
Declare the component. XML name of the UI component is
geoMap. Component declaration example:<maps:geoMap id="map" height="100%" width="100%" center="-99.755859, 39.164141" zoom="4"> </maps:geoMap> -
Define the basic component properties
id,height,width,center,zoom, if necessary where:-
center — coordinates of the initial geographical center of the map (longitude, latitude).
-
zoom — initial zoom level. The default value is
15.
-
-
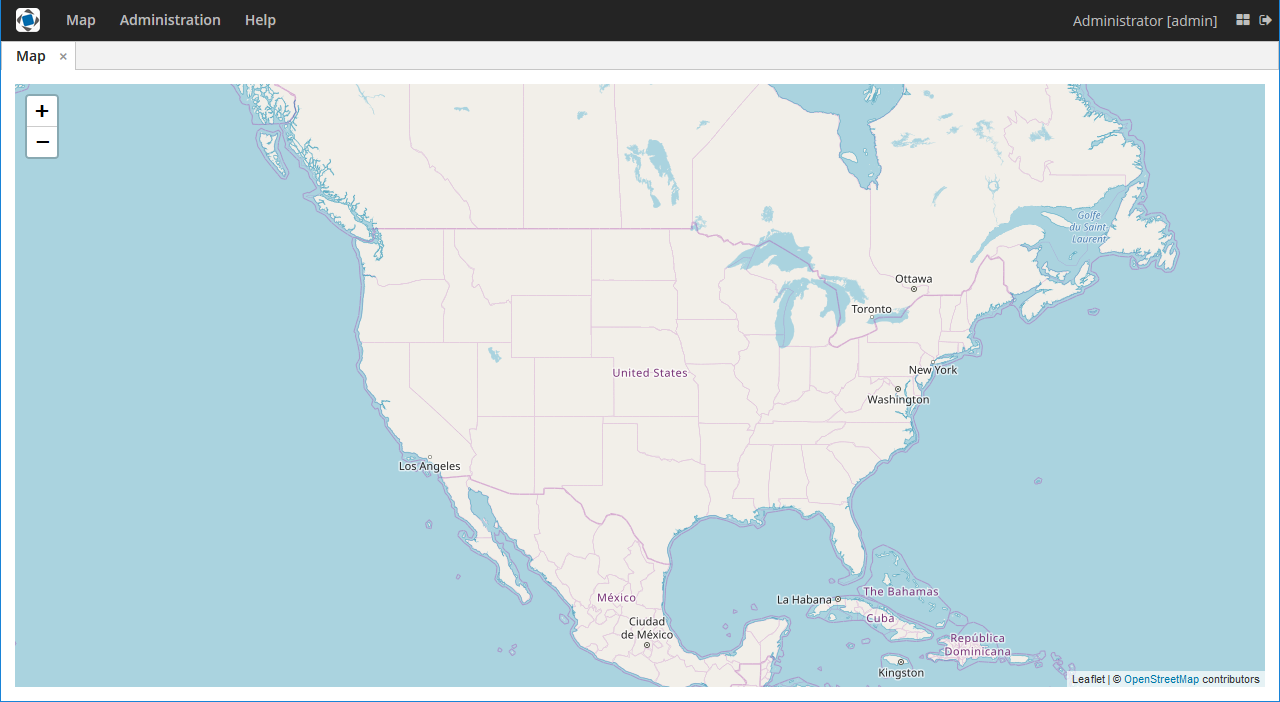
Add one of raster layers to display a map on the screen. Here is an example of OpenStreetMap tile layer.
<maps:tile id="tiles"
          tileProvider="maps_OpenStreetMap"/>
XML descriptor can look like this one:
<?xml version="1.0" encoding="UTF-8" standalone="no"?>
<window xmlns="http://schemas.haulmont.com/cuba/screen/window.xsd"
        caption="Map"
        messagesPack="com.company.mapstest.web"
        xmlns:maps="http://schemas.haulmont.com/maps/0.1/ui-component.xsd">
    <layout>
        <maps:geoMap id="map" height="100%" width="100%" center="-99.755859, 39.164141" zoom="4">
            <maps:layers>
                <maps:tile id="tiles"
                           tileProvider="maps_OpenStreetMap"/>
            </maps:layers>
        </maps:geoMap>
    </layout>
</window>
You can see that OpenStreetMap is added as a tile layout. The screen contains a full-screen map with initial zoom 4.
Additional configuration of the map and its layers can be performed in the screen controller. You need to add the component declared in the XML descriptor with @Inject annotation:
@Inject
private GeoMap map;
@Subscribe
protected void onBeforeShow(BeforeShowEvent event) {
map.setCenter(-99.755859D, 39.164141D);
map.setZoomLevel(4);
TileLayer tileLayer = new TileLayer();
tileLayer.setUrl("https://{s}.tile.openstreetmap.org/{z}/{x}/{y}.png");
tileLayer.setAttributionString("© <a href="https://www.openstreetmap.org/copyright">OpenStreetMap</a> contributors");
map.addLayer(tileLayer);
}See more GeoMap methods and events in Maps API.
5.2. Adding Layers on the Map
Basically, layers are divided into raster and vector layers. Raster layers consist of raster images, while vector layers consist of vector geometries.
The add-on supports the following types of layers:
-
Tile layer is used to display tiles provided by XYZ tiles services.
-
Web Map Service (WMS) layer is used to display tiles from Web Map Service.
-
Vector layer contains geo-objects (entities with geometry attributes).
To add a layer on a map declare the layers element and its configuration in the geoMap element in the XML descriptor. Here is an example of one raster layer and two vector layers.
<maps:geoMap id="map" height="600px" width="100%">
        <maps:layers selectedLayer="salespersonLayer">
            <maps:tile id="tiles" tileProvider="maps_OpenStreetMap"/>
            <maps:vector id="territoryLayer" dataContainer="territoryDc"/>
            <maps:vector id="salespersonLayer" dataContainer="salespersonDc" editable="true"/>
        </maps:layers>
</maps:geoMap>
selectedLayer is a layer which the map is focused on. Selected layer fires events, reacts on user clicks and can be modified by UI interaction in case the layer is editable.
Parameters are common for every type of layers:
-
id — required parameter, specifies the id of the layer.
-
visible — whether the layer is visible.
-
minZoom — minimum zoom level down to which the layer is visible (inclusive).
-
maxZoom — maximum zoom level up to which the layer is visible (inclusive).
Also, you can perform configuration of the layer in the screen controller:
TileLayer tileLayer = new TileLayer();
tileLayer.setUrl("https://{s}.tile.openstreetmap.org/{z}/{x}/{y}.png");
tileLayer.setAttributionString("© <a href="https://www.openstreetmap.org/copyright">OpenStreetMap</a> contributors");
map.addLayer(tileLayer);5.2.1. Adding Raster Layers
Raster layers consist of raster images which is a grid of pixels. Raster layer is usually served as a base background layer of a map. You can download raster images using different providers: tile servers and WMS services.
5.2.1.1. Tile Layer
TileLayer is used to load and display tiles that are served through a web server with URL like http://…/{z}/{x}/{y}.png. Such tiles are usually referred as XYZ tiles.For example, OpenStreetMap tiles URL pattern is: https://{s}.tile.openstreetmap.org/{z}/{x}/{y}.png.
To add a tile layer on a map declare it in the XML descriptor:
<maps:tile id="tiles"
urlPattern="https://{s}.tile.openstreetmap.org/{z}/{x}/{y}.png"
attribution="© <a href="https://www.openstreetmap.org/copyright">OpenStreetMap</a> contributors"/>id parameter is required as well as urlPattern (only if you have not specified tileProvider).
|
Tip
|
The most tile servers require attribution, which you can set in attribution parameter. In our example the credit ©OpenStreetMap contributors will appear in the lower-right corner.
|
In subdomains parameter you can specify comma-separated values for {s} placeholder in the urlPattern. Default values are "a,b,c" which are used by the most tile services including OpenStreetMap.
In order not to clutter the XML descriptors with the URL and attribution strings:
-
Move tile server settings to a Spring bean implementing
com.haulmont.addon.maps.web.gui.components.layer.TileProviderinterface. -
Specify a bean name in a
tileProviderattribute of thetileelement.
OpenStreetMap tile provider comes out of the box, so you can use it like this:
<maps:tile id="tiles"
           tileProvider="maps_OpenStreetMap"/>
Additionally you can perform the tile layer in the screen controller using com.haulmont.addon.maps.web.gui.components.layer.TileLayer class:
TileLayer tileLayer = new TileLayer();
tileLayer.setUrl("https://{s}.tile.openstreetmap.org/{z}/{x}/{y}.png");
tileLayer.setAttributionString("© <a href="https://www.openstreetmap.org/copyright">OpenStreetMap</a> contributors");
map.addLayer(tileLayer);5.2.1.2. WMS Layer
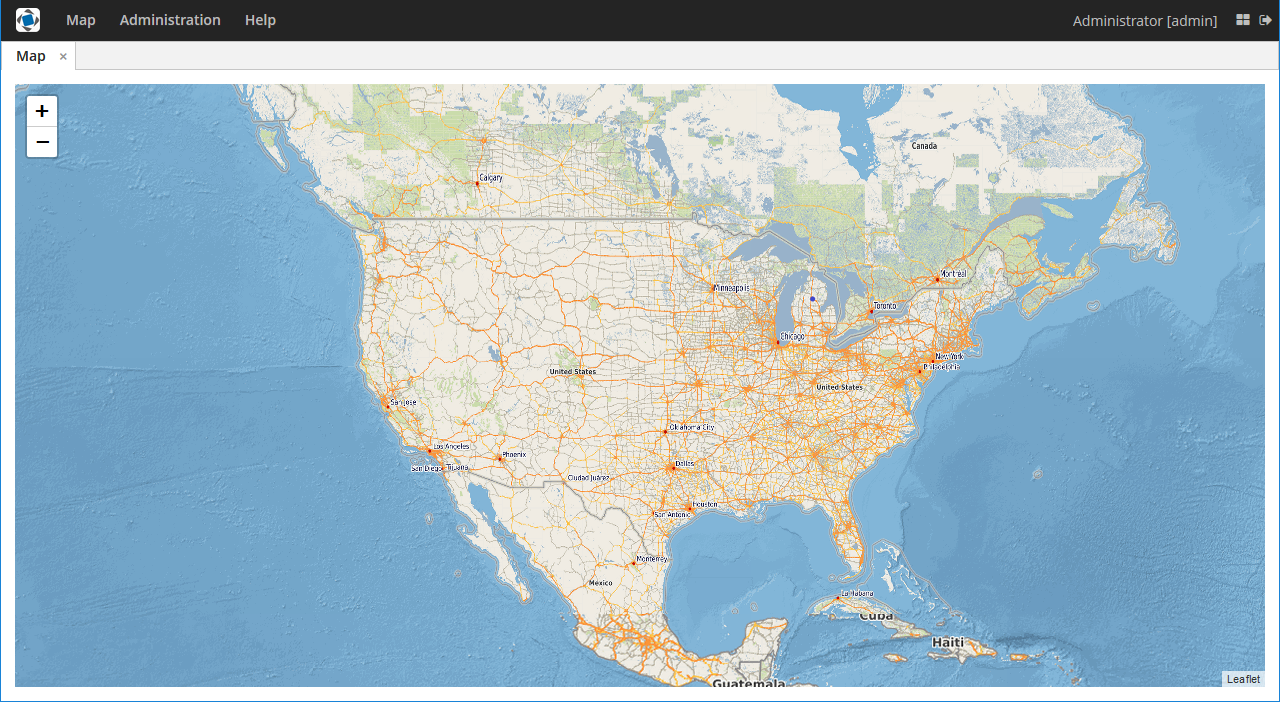
Various WMS services can be used as a map provider.
WMSTileLayer layer can be declared in the XML descriptor:
<maps:wms id="wms"
          url="http://ows.terrestris.de/osm/service?"
          layers="OSM-WMS"
format="image/png"/>id, url and layers are required parameters. Other parameters have default values, which can be redefined.
Also, you can perform a layer in the screen controller using com.haulmont.addon.maps.web.gui.components.layer.WMSTileLayer class:
WMSTileLayer wmsTileLayer = new WMSTileLayer("wms");
wmsTileLayer.setUrl("http://ows.terrestris.de/osm/service?");
wmsTileLayer.setLayers("OSM-WMS");
wmsTileLayer.setFormat("image/png");
map.addLayer(wmsTileLayer);
See more WMSTileLayer methods in Maps API.
5.2.1.3. Image Layer
Image layer is used for displaying an image over specific bounds of a map.
ImageLayer can be declared in the XML descriptor:
<maps:image id="imageLayer"
            image="url:https://legacy.lib.utexas.edu/maps/historical/newark_nj_1922.jpg"
            topLeft="-74.22655, 40.773941"
            bottomRight="-74.12544, 40.712216"
opacity="0.5"/>-
imageparameter describes a path to the image. The path should start with one of the following prefixes defining the source of an image:-
url:— the image will be loaded from the given URL. -
file:— the image will be served from the file system.image="file:D:/myImage.png" -
classpath:— the image will be served from classpath, for example,com/company/demo/web/myImage.png:image="classpath:/com/company/demo/web/myImage.png" -
theme:— the image will be served from the current theme directory, for example,web/themes/hover/awesomeFolder/myImage.png:image="theme:awesomeFolder/myImage.png"You can also load the image programmatically by declaring the
geoImageDelegatefunction:import com.haulmont.addon.maps.web.gui.components.layer.GeoImage; ... @Install(to = "map.imageLayer", subject = "geoImageDelegate") private GeoImage imageDelegate(ImageLayer layer) { String url = "https://legacy.lib.utexas.edu/maps/historical/newark_nj_1922.jpg"; return GeoImage.fromUrl(url); }
-
-
topLeft- the north-west point of the image (longitude, latitude). -
bottomRight- the south-east point of the image (longitude, latitude).
|
Tip
|
In case of using an SVG image in the ImageLayer, make sure that SVG document contains width/height or viewBox attributes, which are needed for the SVG image to behave correctly on zooming a map.
|
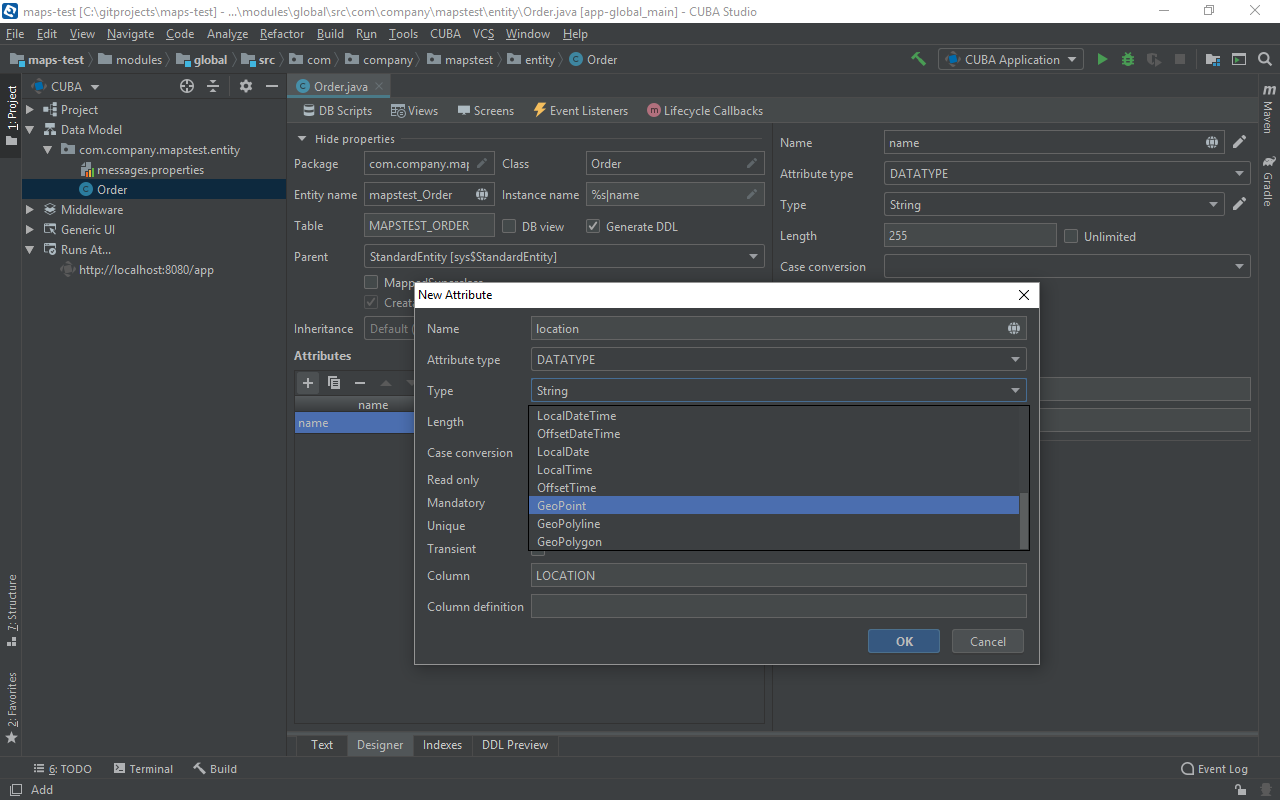
5.2.2. Creating Geo-objects
Geo-object is an entity having a property of a geometry type. This property should have one of the geo-specific datatypes that are included in the com.haulmont.addon.maps.gis.datatypes package:
Datatype |
Java type |
GeoPoint |
org.locationtech.jts.geom.Point |
GeoPolyline |
org.locationtech.jts.geom.LineString |
GeoPolygon |
org.locationtech.jts.geom.Polygon |
To add the property:
-
Create a new attribute and select a geo-specific datatype from the list.
-
Add the following annotations:
-
@Geometry— marks that the property is to be used when displaying the geo-object on a map.TipGeo-object must have one geometry property, otherwise an exception will be thrown when drawing the layer. -
@Convert— specifies a JPA converter defining how the datatype will be persisted. JPA converters for the component datatypes are included in the package:com.haulmont.addon.maps.gis.converters.
-
The current version of the component includes converters that transform coordinates into the WKT format which consequently persists as a text. While loading from DB this text will be parsed back into the objects.
Here is an example of geo-object Address:
@Entity
public class Address extends StandardEntity {
    ...

    @Column(name = "LOCATION")
    @Geometry
    @MetaProperty(datatype = "GeoPoint")
    @Convert(converter = CubaPointWKTConverter.class)
    protected Point location;

    ...
}
As you can see, Address is a simple entity, one of which properties location is of a org.locationtech.jts.geom.Point type.
5.2.3. Adding Vector Layers
Vector layers help to effectively work with a group of related geo-objects. Vector layers enable simple displaying, interactive editing and drawing geo-objects on a map.
5.2.3.1. VectorLayer Class
VectorLayer is a base layer for displaying your entities on the map. It is a data-aware component acting as a connector between data (geo-objects) and a map.
To bind geo-objects with the layer you need to pass a datacontainer (or datasource in case of using in legacy screens) to the vector layer. This can be declared in the XML descriptor:
<maps:geoMap id="map">
  <maps:layers>
    <maps:vector id="orderLayer" dataContainer="orderDc"/>
  </maps:layers>
</maps:geoMap>
id and dataContainer (dataSource in case of using in legacy screens) are required parameters. Vector layer works with both InstanceContainer and CollectionContainer.
To make the layer editable add the editable parameter:
<maps:geoMap id="map">
  <maps:layers selectedLayer="orderLayer">
    <maps:vector id="orderLayer" dataContainer="orderDc" editable="true"/>
  </maps:layers>
</maps:geoMap>|
Tip
|
To edit/draw geometries on the editable vector layer, the layer should be selected on the map. |
Additionally you can create VectorLayer in the screen controller:
VectorLayer<Order> orderLayer = new VectorLayer<>("orderLayer", new ContainerVectorLayerItems<>(ordersDc));
map.addLayer(orderLayer);
To determine geometry style for geo-objects use setStyleProvider() method. In CUBA 7.0+ screens you can perform this declaratively using the @Install annotation in the screen controller, for example:
@Install(to = "map.territoryLayer", subject = "styleProvider")
private GeometryStyle territoryLayerStyleProvider(Territory territory) {
        return new PolygonStyle()
               .setFillColor("#08a343")
               .setStrokeColor("#004912")
               .setFillOpacity(0.3)
               .setStrokeWeight(1);
}
Classes for geometry style are included in the com.haulmont.addon.maps.web.gui.components.layer.style package.
Geo-objects can be selected by user click or automatically from the associated data container.
setSelectedGeoObject() method sets the geo-object which the layer is focused on. For example, if an entity is opened in an editor screen it will be implicitly selected in a corresponding vector layer.
See more VectorLayer methods in Maps API.
5.2.3.2. Working with a Collection of Geo-objects
To display a collection of geo-objects, add a VectorLayer with a bound CollectionContainer to a map:
<maps:geoMap id="map">
  <maps:layers>
    ...
    <maps:vector id="territoriesLayer" dataContainer="territoriesDc"/>
  </maps:layers>
</maps:geoMap>
VectorLayer is subscribed to changes in the corresponding data container and automatically refreshes when new items are added to the data container or in case of removing items from the container.
If VectorLayer is set as selected, it becomes interactive, which means a user can select a geo-object by clicking on it.
<maps:geoMap id="map">
  <maps:layers selectedLayer="territoriesLayer">
    ...
    <maps:vector id="territoriesLayer" dataContainer="territoriesDc"/>
  </maps:layers>
</maps:geoMap>
Selecting a geo-object produces the GeoObjectSelectedEvent. You can subscribe to this event in the screen controller, for example, to select the geo-object in a table as well:
@Subscribe("map.territoriesLayer")
private void onTerritorySelected(VectorLayer.GeoObjectSelectedEvent<Territory> event) {
    territoriesTable.setSelected(event.getItem());
}|
Tip
|
By default, geo-objects are selected by click, but you can change this behavior by setting |
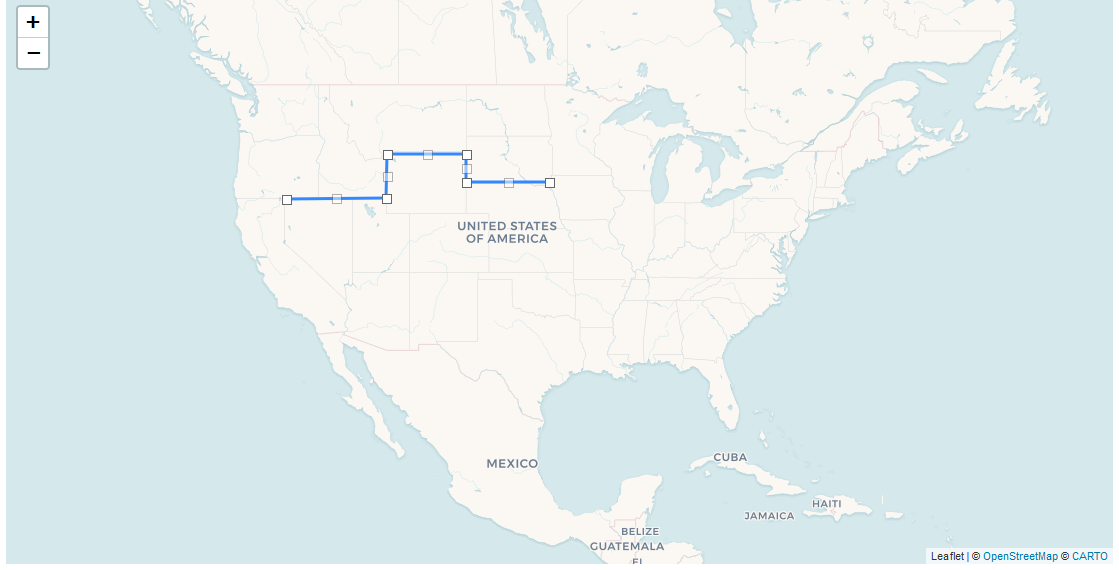
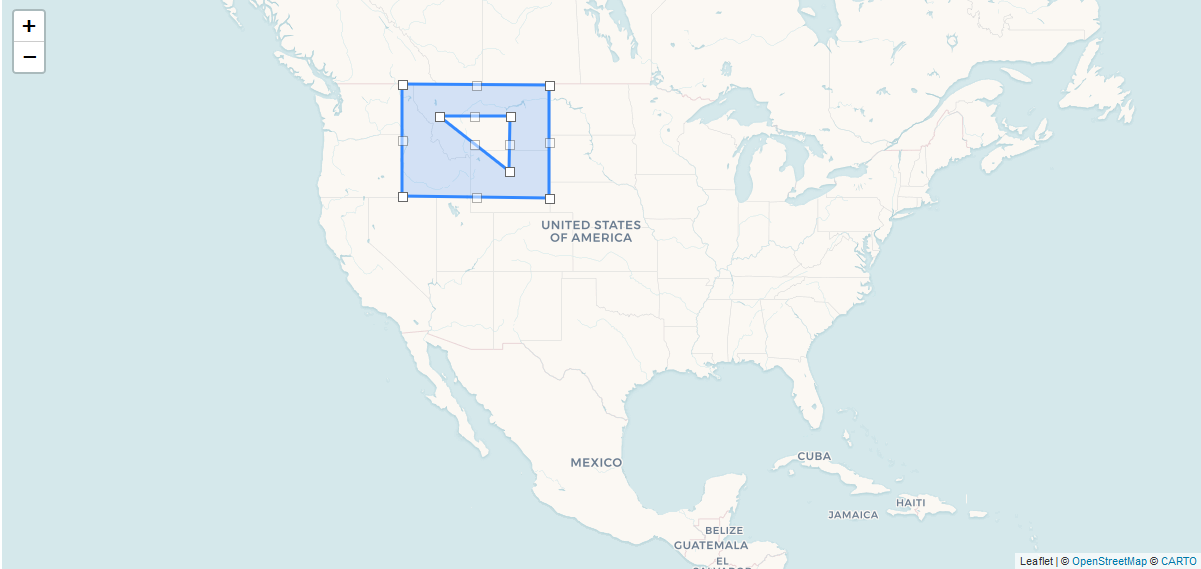
The geometry of a geo-object can be interactively modified if the layer is set as editable. First, you need to select the geo-object via UI by clicking on it, or programmatically by calling the setSelectedGeoObject method of the VectorLayer. After that the geometry of the selected geo-object can be edited in one of the ways described below:
-
if the geometry value is null (the geo-object is not displayed on the map), then the map turns into the drawing mode (the cursor becomes crosshair) and you can draw a geometry as described here.
-
if the geometry value is not null, then the geometry turns into the editable mode (point icons become draggable, polylines and polygons show small white squares) and you can modify or remove the geometry.
Interactive adding a new geo-object to a vector layer can be implemented in two ways:
-
By adding a new geo-object instance to the data container and selecting it:
private void addTerritory() {
    VectorLayer<Territory> territoriesLayer = map.getLayer("territoriesLayer");
    Territory territory = dataContext.create(Territory.class);
    territoriesDc.getMutableItems().add(territory);
    territoriesLayer.setSelectedGeoObject(territory);
}
The drawback of this method is that it adds a new geo-object instance every time the method is called, even if the geometry hasn’t been drawn. It can be worked around by using a temporary geo-object variable and checking whether the geometry was set to the previously created instance:
private Territory newTerritory; private void addTerritory() { VectorLayer<Territory> territoriesLayer = map.getLayer("territoriesLayer"); if (newTerritory == null || newTerritory.getPolygon() != null) { Territory territory = dataContext.create(Territory.class); territoriesDc.getMutableItems().add(territory); newTerritory = territory; } territoriesLayer.setSelectedGeoObject(newTerritory); } -
Using CanvasLayer to draw a geometry:
private void addTerritory() {
    VectorLayer<Territory> territoriesLayer = map.getLayer("territoriesLayer");
    CanvasLayer canvas = map.getCanvas();
    map.selectLayer(canvas);

    canvas.drawPolygon(polygon -> {
        Territory territory = dataContext.create(Territory.class);
        territory.setPolygon(polygon.getGeometry());
        territoriesDc.getMutableItems().add(territory);
        territoriesLayer.setSelectedGeoObject(territory);
        canvas.removePolygon(polygon);
        map.selectLayer(territoriesLayer);
    });
}
With this approach, the geo-object is created only after the geometry has been drawn.
5.2.3.3. Clustering
For a vector layer consisting of geo-points it is possible to group nearby points into clusters:
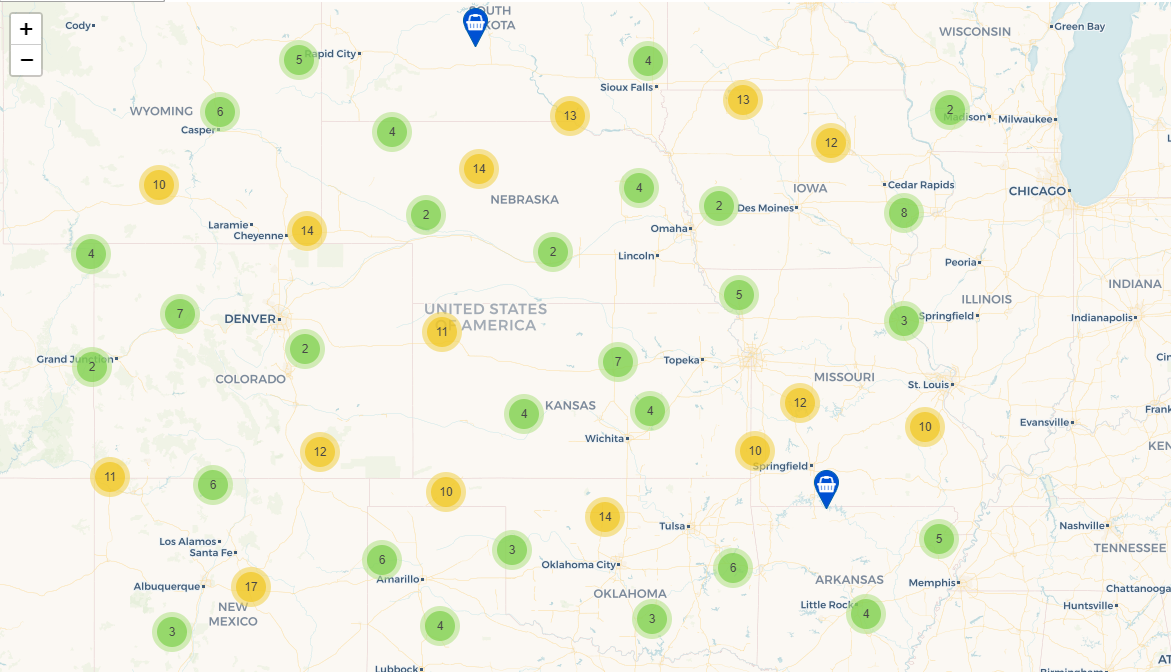
To enable clustering add cluster element inside vector in the XML descriptor:
<maps:vector id="locations" dataContainer="locationsDc" >
  <maps:cluster/>
</maps:vector>
You can specify additional clustering options:
-
radius — maximum radius that a cluster will cover, in pixels. The default value is
80. -
weightProperty — if specified, then each point of the layer will have a weight value (int) defined by weight property of a geo-object. This value will be used when calculating the summed up value of the cluster (by default, the number of points is used).
-
showCoverage — show bounds of the cluster when hovering a mouse over it.
-
disableAtZoom — specifies a zoom level from which clustering will be disabled.
-
showSinglePointAsCluster — show single point as a cluster of 1 size.
5.2.3.4. Working with Underlying Vaadin Components of Geo-objects
For each geo-object displayed on a map the add-on creates an instance of the com.haulmont.addon.maps.web.gui.components.leaflet.translators.GeoObjectWrapper class that keeps the underlying Vaadin Component. This class provides methods to work directly with the wrapped component:
-
openPopup()- opens the pop-up window of the geo-object, if the pop-up content is specified. -
closePopup()- closes the pop-up window of the geo-object. -
openTooltip()- opens the tooltip of the geo-object, if the tooltip content is specified. -
closeTooltip()- closes the tooltip of the geo-object. -
getLeafletComponent()- returns the underlying Vaadin Component (connected with the Leaflet component on the client side).
To obtain geo-object wrappers for a vector layer invoke the getGeoObjectWrappersMap() method of the WebGeoMap class (implementation of the GeoMap) and pass the layer to it:
VectorLayer<Territory> territoriesLayer = map.getLayer("territoriesLayer");
Map<?, GeoObjectWrapper<Salesperson>> geoObjectWrappersMap =
        ((WebGeoMap) map).getGeoObjectWrappersMap(territoriesLayer);
The returned map contains entries in which keys are geo-objects IDs and values are corresponding GeoObjectWrapper instances. So you can obtain GeoObjectWrapper of the particular geo-object this way:
GeoObjectWrapper<Salesperson> geoObjectWrapper = geoObjectWrappersMap.get(salesperson.getId());
if (geoObjectWrapper != null) {
    geoObjectWrapper.openPopup();
}|
Warning
|
If the geometry value of the geo-object is null, then there is no GeoObjectWrapper for this geo-object.
|
Also, be aware that GeoObjectWrapper instances can be changed or replaced after refreshing the layer. So always use this map to get the relevant wrapper instance.
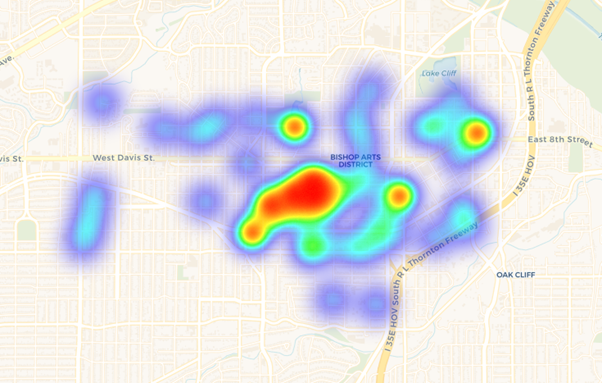
5.2.4. Heatmap Layer
HeatMapLayer provides a visual representation of data density across a set of geographical points.
HeatMapLayer can be declared in the XML descriptor:
<maps:heatmap id="heatmapLayer" dataContainer="ordersDc"/>or created programmatically in a screen controller using com.haulmont.addon.maps.web.gui.components.layer.HeatMapLayer class:
HeatMapLayer heatMapLayer = new HeatMapLayer("heatmapLayer");
heatMapLayer.setDataContainer(ordersDc);
map.addLayer(heatMapLayer);
The layer’s data can be provided in one of two different ways:
-
Using
dataContainer:<maps:heatmap id="heatmapLayer" dataContainer="ordersDc"/>The items of the data container should be geo-objects having the
@Geometryproperty of thePointtype. The intensity value of each point equals1by default. If the intensity value should be taken from some other property of number type (for example,amount), this property can be specified along with the data container:<maps:heatmap id="heatmapLayer" dataContainer="ordersDc" intensityProperty="amount"/> -
By specifying
dataDelegatefunction which builds a map of points and their intensity values:@Install(to = "map.heatmapLayer", subject = "dataDelegate") private Map<Point, Double> setHeatmapDataDelegate(HeatMapLayer layer) { return ordersDc.getItems().stream() .filter(order -> order.getLocation()!= null) .collect(Collectors.toMap(Order::getLocation, this::calculateIntensity)); } private Double calculateIntensity(Order order) { ... }TipThe intensity value of a point is in a range between 0and1by default. You can change this range by setting different maximum intensity value in themaximumIntensityproperty.
You can customize the appearance of a heatmap using various options:
-
maximumIntensity — the maximum point intensity. The default value is
1. -
blur — the amount of blur in a point. The default value is
15. -
radius — the radius of each point of a heatmap in pixels. The default value is
25. -
minOpacity — the minimum opacity the heat will start at. The default value is
0.05. -
maxIntensityZoom — the zoom level where the points reach maximum intensity (as intensity scales with zoom). By default, equals the maxZoom of a map.
-
gradient — the color gradient config defined by a map of pairs
[intensityValue : rgbColor]. Can be described in the XML descriptor this way:<maps:heatmap id="heatmap" dataContainer="ordersDc"> <maps:gradient> <maps:intensity value="0.4" color="blue"/> <maps:intensity value="0.65" color="lime"/> <maps:intensity value="1" color="red"/> </maps:gradient> </maps:heatmap>
5.3. Drawing Geometry
Open a screen containing a map with an editable VectorLayer.
To draw a point just click on the map.
For drawing a polyline or a polygon specify the first point and continue clicking on the map. To stop drawing click the last added point.
To add a hole inside a polygon right-click and select Add hole. Start drawing a hole inside the polygon.
To delete a geometry right-click and select Clear geometry.
5.4. Using Canvas Layer
CanvasLayer is a utility layer belonging to a map by default. This layer is used to draw and display geometries on a map. It is similar to VectorLayer since they both display vector geometries. The difference is that VectorLayer works with geo-objects while CanvasLayer works just with geometries.
It makes the task of displaying some geometry on a map really straightforward so there is no need to store data in an entity.
To obtain the canvas layer of a map call map.getCanvas().
Here is an example of adding a geographical point on the canvas layer:
CanvasLayer canvasLayer = map.getCanvas();

Point point = address.getLocation();
canvasLayer.addPoint(point);
Methods that add geometries on a canvas return an object that represents this geometry on the canvas: CanvasLayer.Point, CanvasLayer.Polyline or CanvasLayer.Polygon. Using this object you can define a style or pop-up window, subscribe to events connected with the geometry, or use this object when you want to remove the geometry from the canvas.
Here is an example:
CanvasLayer.Point location = canvasLayer.addPoint(address.getLocation());
location.setStyle(new PointStyle(
        new FontPointIcon(CubaIcon.HOME)
                .setIconPathFillColor("#ff0000")
                .setIconTextFillColor("white")
                .setIconPathStrokeColor("black")))
        .setPopupContent(address.getName())
        .setEditable(true)
        .addModifiedListener(modifiedEvent -> address.setLocation(modifiedEvent.getGeometry()));
You can also draw geometries on the canvas via UI. For example, to draw a point invoke canvas.drawPoint() method. After this method is called the map will turn into the drawing mode. The method accepts Consumer<CanvasLayer.Point> function, in which you can perform additional actions with the drawn point.
canvasLayer.drawPoint(point -> {
    address.setLocation(point.getGeometry());
});|
Tip
|
Before drawing geometries via UI on the canvas you need to select the canvas on the map by calling map.selectLayerById(CanvasLayer.ID).
|
You can also specify the selected layer in the XML descriptor:
<maps:geoMap id="map" height="600px" width="100%">
        <maps:layers selectedLayer="canvas">
            <maps:tile id="tiles" tileProvider="maps_OpenStreetMap"/>
                ...
        </maps:layers>
</maps:geoMap>
See more CanvasLayer methods and events in Maps API.
5.5. Additional Options
5.5.1. Pop-up Window
The add-on provides an ability to display some information in a pop-up window on a map.
The GeoMap UI component has the openPopup(PopupWindow popupWindow) method that instantly opens the given pop-up window. Class PopupWindow contains two main parameters:
-
point — the geographical point where the pop-up will be opened.
-
content — the HTML content of the pop-up window.
It is also possible to set the additional options for a pop-up window by passing an instance of a PopupWindowOptions class, which contains the following parameters:
-
closeButtonEnabled — whether the close button is enabled in a pop-up window.
-
closeOnClick — whether pop-up should be closed when a user clicks on the map.
-
maxWidth — max width of the pop-up, in pixels. The default value is
300. -
minWidth — min width of the pop-up, in pixels. The default value is
50.
It is possible to attach a pop-up window to a geometry. The pop-up window will be opened when a user clicks on the geometry on a map.
In case of Canvas geometries, you can specify pop-up window in this way:
 CanvasLayer.Point location = canvasLayer.addPoint(address.getLocation());
    PopupWindowOptions popupWindowOptions = new PopupWindowOptions()
                .setCloseOnClick(true)
                .setMaxWidth(400);
    location.setPopupContent(address.getName())
            .setPopupOptions(popupWindowOptions);
In case of VectorLayer, you can specify a popupContentProvider, which is a function that generates content for each geo-object’s pop-up window based on some geo-object parameters.
It can be performed declaratively using the @Install annotation in a screen controller, for example:
@Install(to = "map.salespersonLayer", subject = "popupContentProvider")
private String salespersonLayerPopupContentProvider(Salesperson salesperson) {
    return String.format(
            "<b>Name: </b> %s " +
                    "<p>" +
                    "<b>Phone: </b> %s",
            salesperson.getName(),
            salesperson.getPhone());
}
5.5.2. Tooltip
In addition to pop-up windows, you can display small text in tooltips. Tooltips generally appear on hovering over geometries, but you can define them to be permanent, thereby using them as text labels picked to geometries:
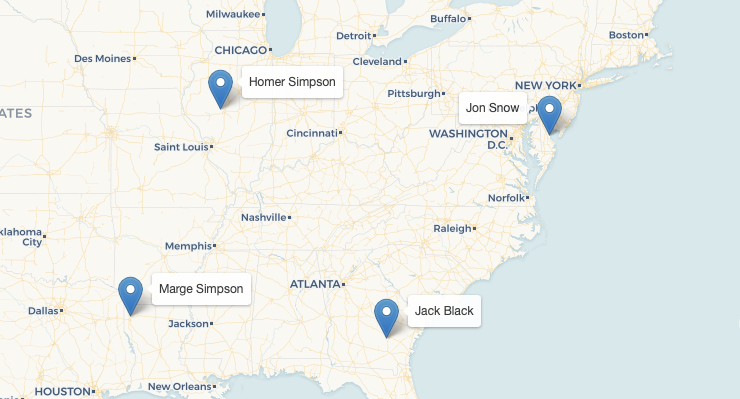
In case of VectorLayer, you can specify the tooltipContentProvider, which is a function that generates content for each geo-object’s tooltip based on some geo-object parameters.
It can be performed declaratively using the @Install annotation in the screen controller, for example:
@Install(to = "map.salespersonLayer", subject = "tooltipContentProvider")
private String salespersonLayerTooltipContentProvider(Salesperson salesperson) {
    return salesperson.getName();
}
In case of Canvas geometries, you can specify tooltips this way:
CanvasLayer.Point location = canvasLayer.addPoint(address.getLocation());
TooltipOptions tooltipOptions = new TooltipOptions()
        .setPermanent(true)
        .setOpacity(0.7);
location.setTooltipContent(address.getName())
        .setTooltipOptions(tooltipOptions);
It is also possible to set additional options for a tooltip box by passing an instance of the TooltipOptions class, which contains the following parameters:
-
direction — defines where a tooltip opens in relation to the geometry:
right,left,top,bottom,center,auto. The default value isauto). Theautovalue dynamically switches betweenrightandleftaccording to the geometry position on the map. -
permanent — defines whether to open the tooltip permanently or only on mouseover. The default value is
false. -
sticky — if set to
true, a tooltip will follow the mouse instead of being fixed at the feature center. The default value isfalse. -
interactive — if set to
true, a tooltip will accept mouse clicks. The default value isfalse. -
opacity — tooltip box opacity. The default value is
0.9.
5.5.3. Point Icons
Point style is defined by its icon. There are different kinds of icons:
-
The default icon is a blue marker image and it is used when the style is not specified for a point.
-
FontPointIconlooks like the default icon, but you can specify Font Awesome symbol inside it:@Install(to = "map.orderLayer", subject = "styleProvider") private GeometryStyle orderLayerStyleProvider(Order order) { return new PointStyle( new FontPointIcon(CubaIcon.SHOPPING_BASKET) .setIconPathFillColor("#0051d3")); }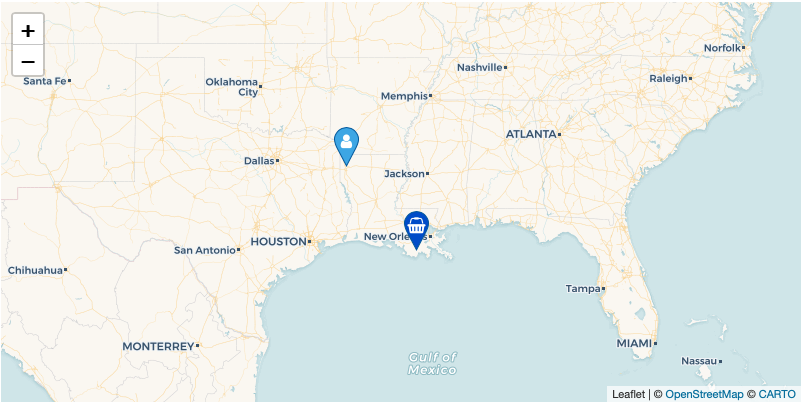
-
ImagePointIconallows you to use an image as an icon.@Install(to = "map.orderLayer", subject = "styleProvider") private GeometryStyle orderLayerStyleProvider(Order order) { return new PointStyle( new ImagePointIcon("classpath:/com/haulmont/demo/maps/web/cuba_icon.png") .setIconSize(33, 33)); } -
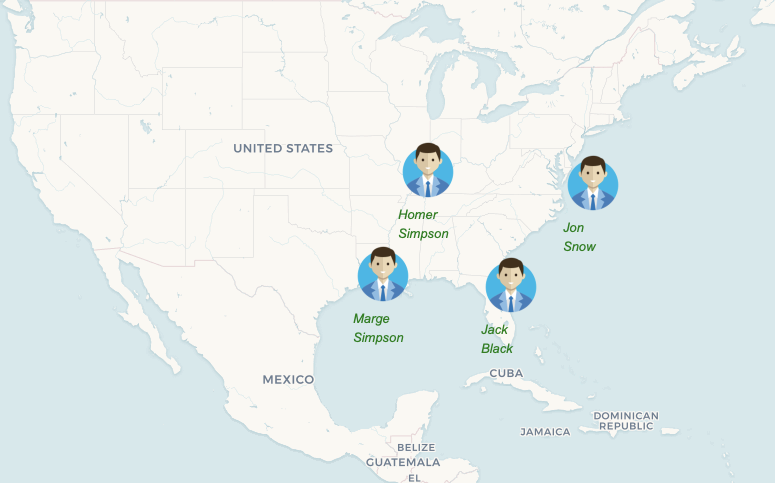
DivPointIconis a fully custom lightweight icon that uses the<div>element instead of an image.For example, you can create an icon that combines an image with a text label:
private String divElement = "<img src='https://cdn3.iconfinder.com/data/icons/business-avatar-1/512/3_avatar-128.png' width=60 height = 60/>\n" +
            "<font color = 'green' face = 'arial' size = 2> <i>NAME</i></font>";

@Install(to = "map.salespersonLayer", subject = "styleProvider")
private GeometryStyle salespersonLayerStyleProvider(Salesperson salesperson) {
    return new PointStyle(
            new DivPointIcon(divElement.replaceAll("NAME", salesperson.getName()))
                    .setStyles("my-div-style")
                    .setPopupAnchor(30, 0));
}
Points with this style look like this:
To find out more about icons setting, please refer to the JavaDoc.
Appendix A: Maps API
GeoMap UI component
The GeoMap UI component displays a map. The map is built by superposing multiple layers.
GeoMap methods:
-
void addLayer(Layer)— adds a layer to the map. -
void removeLayer(Layer)— removes a layer from the map. -
<T extends Layer> T getLayer(String)— returns a layer by its ID. ThrowsIllegalArgumentExceptionif a layer with the given ID is not present on the map. -
<T extends Layer> T getLayerOrNull(String layerId)— returns a layer by its ID ornullif a layer with the given ID is not present on the map. -
List<Layer> getLayers()— returns a list of layers currently added to the map. -
void setCenter(double, double)— sets the initial geographic center of the map (longitude, latitude). -
Point getCenter()— returns current geographic center of the map. -
void setZoomLevel(double)— sets map zoom level. -
double getZoomLevel()— returns current map zoom level. -
void setMaxZoom(int)— sets maximum map zoom level. -
void setMinZoom(int)— sets minimum map zoom level. -
void zoomToBounds(Point topLeft, Point bottomRight)— sets a map view that contains the given geographical bounds with the maximum zoom level possible. -
void zoomToGeometry(Geometry geometry)— sets a map view that contains envelope of the given geometry with the maximum zoom level possible. -
GeoMap.Bounds getBounds()— returns the bounds of the map which define the viewport of the map. -
void setReadOnly(boolean)— enables/disables zooming and dragging the map (changing the viewing area). -
CanvasLayer getCanvas()— returns the canvas layer of the map. -
void selectLayer(Layer layer)— sets the selected (active) layer of the map. -
void selectLayerById(Layer layer)— sets the selected (active) layer of the map by the given id of the layer. -
Layer getSelectedLayer()— returns the selected layer of the map. -
void openPopup(PopupWindow)— opens a pop-up info window.
GeoMap events:
-
ClickEvent— event fired after clicking on a map. -
RightClickEvent— event fired after right click on a map. -
MoveEndEvent— event fired after changing the map’s viewing area (as a result of zooming/dragging). -
ZoomEndEvent— event fired after zooming a map. -
DragEndEvent— event fired after dragging a map. -
LayerAddedEvent— event fired after adding a layer on a map. -
LayerRemovedEvent— event fired after removing a layer from a map. -
SelectedLayerChangedEvent— event fired after changing the map’s selected layer.
Layers
TileLayer methods:
-
void setUrl(String)— sets URL pattern of a tile server. -
void setAttributionString(String)— sets attribution string. -
void setOpacity(Double)— sets tiles opacity value in the range between 0.0 (fully transparent) to 1.0 (fully opaque).
WMSTileLayer methods:
-
void setUrl(String)— sets URL of a WMS service. -
void setOpacity(Double)— sets tiles opacity value in the range between 0.0 (fully transparent) to 1.0 (fully opaque). -
void setCrs(CRS)— sets CRS to be used in the WMS. -
void setLayers(String)— sets WMS service layers to display on a map (as a comma-separated list). -
void setStyles(String)— sets comma-separated list of WMS styles. -
void setFormat(String)— sets WMS image format. -
void setTransparent(boolean)— sets whether the layer is to be transparent. -
void setVersion(String)— sets WMS service version.
VectorLayer methods:
-
void setStyleProvider(Function<? super T, GeometryStyle>)— sets a function that determines geometry style for a given geo-object. In CUBA 7.0+ screens you can perform this declaratively using the@Installannotation in the screen controller. -
setPopupContentProvider(Function<? super T, String>)— sets a function that determines content for bound pop-ups which will be opened by clicking on geo-objects on a map. In CUBA 7 screens you can perform this declaratively using the @Install annotation in the screen controller, for example:@Install(to = "map.territoryLayer", subject = "popupContentProvider") private String territoryLayerPopupContentProvider(Territory territory) { return territory.getName(); } -
void setPopupWindowOptions(PopupWindowOptions)— sets the explicit style parameters for geo-object’s bound pop-ups. -
void setTooltipContentProvider(Function<? super T, String>)— sets a function that determines content for bound tooltips. -
void setTooltipOptions(TooltipOptions)— sets the explicit style parameters for geo-object’s bound tooltips. -
void setSelectedGeoObject(T)— sets the selected geo-object of the layer.
VectorLayer events:
-
GeoObjectSelectedEvent— event fired when selected geo-object has changed.
CanvasLayer methods:
-
CanvasLayer.Point addPoint(org.locationtech.jts.geom.Point)— adds a point to the canvas. -
CanvasLayer.Polyline addPolyline(org.locationtech.jts.geom.LineString)— adds a polyline to the canvas. -
CanvasLayer.Polygon addPolygon(org.locationtech.jts.geom.Polygon)— adds a polyline to the canvas. -
void removePoint(CanvasLayer.Point)— removes a point from the canvas. -
void removePolyline(CanvasLayer.Polyline)— removes a polyline from the canvas. -
void removePolygon(CanvasLayer.Polygon)— removes a polygon from the canvas. -
void clear()— removes all geometries from the canvas. -
void drawPoint(Consumer<CanvasLayer.Point>)— activates the point drawing mode on the map. After the point is drawn, the given consumer action is applied to it. -
void drawPolyline(Consumer<CanvasLayer.Polyline>)— activates the polyline drawing mode on the map. After the polyline is drawn, the given consumer action is applied to it. -
void drawPolygon(Consumer<CanvasLayer.Polygon>)— activates the polygon drawing mode on the map. After the polygon is drawn, the given consumer action is applied to it. -
void cancelDrawing()— cancels the drawing mode.
addPoint method returns an instance of CanvasLayer.Point which controls the added point on the canvas.
CanvasLayer.Point methods:
-
setStyle(PointStyle)— applies a style to the point. -
setPopupContent(String)— adds a pop-up window to be opened as user clicks on the point. -
setPopupOptions(PopupWindowOptions)— specifies options for a pop-up window added by previous method. -
setTooltipContent(String)— adds a tooltip to be opened as user hovers on the point. -
setTooltipOptions(TooltipOptions)— specifies options for a tooltip added by previous method.
CanvasLayer.Point events:
-
ClickEvent— event fired after clicking on the point. -
RightClickEvent— event fired after right click on the point. -
ModifiedEvent— event fired after modifying the point (as a result of drag and drop via UI).
addPolyline method returns an instance of CanvasLayer.Polyline which controls the added polyline on the canvas.
CanvasLayer.Polyline methods:
-
setStyle(PolylineStyle)— applies a style to the polyline. -
setPopupContent(String)— adds a pop-up window to be opened as user clicks on the polyline. -
setPopupOptions(PopupWindowOptions)— specifies options for a pop-up window added by previous method. -
setTooltipContent(String)— adds a tooltip to be opened as user hovers on the polyline. -
setTooltipOptions(TooltipOptions)— specifies options for a tooltip added by previous method.
CanvasLayer.Polyline events:
-
ClickEvent— event fired after clicking on the polyline. -
RightClickEvent— event fired after right click on the polyline. -
ModifiedEvent— event fired after modifying the polyline via UI.
addPolygon method returns an instance of CanvasLayer.Polygon which controls the added polygon on the canvas.
CanvasLayer.Polygon methods:
-
setStyle(PolygonStyle)— applies a style to the polygon. -
setPopupContent(String)— adds a pop-up window to be opened as user clicks on the polygon. -
setPopupOptions(PopupWindowOptions)— specifies options for a pop-up window added by previous method. -
setTooltipContent(String)— adds a tooltip to be opened as user hovers on the polygon. -
setTooltipOptions(TooltipOptions)— specifies options for a tooltip added by previous method.
CanvasLayer.Polygon events:
-
ClickEvent— event fired after clicking on the polygon. -
RightClickEvent— event fired after right click on the polygon. -
ModifiedEvent— event fired after modifying the polygon via UI.
You can subscribe to events fired by a particular canvas geometry or you can subscribe to events fired by all points, polylines or polygons using the CanvasLayer interface.
CanvasLayer.Point, CanvasLayer.Polyline, CanvasLayer.Polygon inherit methods from CanvasLayer.Geometry.
CanvasLayer.Geometry methods:
-
org.locationtech.jts.geom.Geometry getGeometry()— returns the geometry value. -
setEditable(boolean)— sets whether the geometry is to be modifiable. -
isEditable()— whether the geometry is modifiable. -
openPopup()— opens the pop-up of the geometry if the pop-up text is specified. -
openTooltip()— opens the tooltip of the geometry if the tooltip text is specified. -
closePopup()— closes the pop-up of the geometry. -
closeTooltip()— closes the tooltip of the geometry.
Appendix B: Glossary
Web Map Service
Web Map Service (WMS) is an OGC standard for serving up map images over HTTP. Map images are usually generated by a map server using data from GIS database. This format is similar to map tiles, but more general and not so well optimized for using in web applications.
WMS supports a number of different request types, but the main operations are:
-
GetCapabilities — operation that returns an XML document describing the service (supported parameters, image formats, available layers, etc.).
-
GetMap — operation that returns a map image for a specified area and content. The add-on uses this operation to obtain images from WMS.
It’s important not to confuse the concept of the add-on’s layer with the layer in WMS. WMS provides a set of layers defined in the GetCapabilities XML document. The WMS Layer of the add-on displays the resulting images provided by WMS. These images are being built using one or more layers in WMS.
The add-on does not work with GetCapabilities operation, so you can find out the information about the available layers in WMS in one of the following ways:
Useful links:
-
OSM WMS Servers.
XYZ tiles
XYZ is a de facto OpenStreetMap standard, also known as Slippy Map Tilenames, defining scheme for tiles that are served through a web server.
These tiles can be accessed via URL following certain pattern: http://…/{z}/{x}/{y}.png, where z is the zoom level, and x,y identify the tile.
For example, OpenStreetMap tiles URL pattern is: https://{s}.tile.openstreetmap.org/{z}/{x}/{y}.png.
Useful links:
-
Tile servers based on OpenStreetMap data.
-
Tile providers preview — here you can find and preview various XYZ tile services. Some of them are free, while others require registration and may have free tile requests limit. Be sure to check the providers usage policies before using them.
-
Mapbox tile API.
-
HERE tile API.