1. Overview
This component provides an ability to display maps using a preferable tile provider. The add-on is based on LeafletJS library and supports XYZ tiles as well as professional WMS services.
A layer-based approach enables using layers as structural units of a map. Tile layers are used as a base background and vector layers are used to show and set entities on a map.
The add-on extends standard CUBA datatypes with geometry types from the JTS library, which simplifies creating geometry properties.
Key features:
-
Not coupled to a particular map provider
-
Straightforward binding entities to a map
-
Layer-based design
-
Declarative way of defining maps
-
Simple drawing geometries
See sample application, using this component.
2. Installation
To install the component in your project, do the following steps:
-
Open your application in CUBA Studio.
-
Click Edit in the Project properties panel.
-
On the App components panel click the Plus button next to Custom components.
-
Paste the add-on coordinates in the corresponding field as follows:
group:name:version.-
Artifact group:
com.haulmont.addon.maps -
Artifact name:
maps-global -
Version:
add-on version
-
-
Add the repository of OSGeo tools. On the Repositories panel click the Plus button and specify the following URL:
Then click OK.
-
Click OK to confirm and save project properties.
3. Usage
The add-on enables you working with a map. Content of a map is built on layers which are structural units of a map. To operate with maps you need to add a map component and one and more layers. There are raster layers represented by tiles and vector layers consisting of vector geometries.
3.1. Map Component
To display a map in your application screen use the com.haulmont.addon.maps.web.gui.components.GeoMap UI component.
To add the component, do the followings:
-
Declare the
mapsnamespace in the root element in the screen XML descriptor:xmlns:maps="http://schemas.haulmont.com/maps/0.1/ui-component.xsd" -
Declare the component. XML name of the UI component is
geoMap. Component declaration example:<maps:geoMap id="map" height="600px" width="100%" center="-46.005163, 51.532268" zoom="14"/> </maps:geoMap> -
Define the basic component properties
id,height,width,center,zoom, if necessary where:-
center - coordinates of the initial geographical center of the map (longitude, latitude)
-
zoom - initial zoom level
-
Additional configuration of the map and its layers can be performed in the screen controller. You need to add the component declared in the XML descriptor with @Inject annotation:
@Inject
private GeoMap map;

@Subscribe
protected void onBeforeShow(BeforeShowEvent event) {
map.setCenter(-46.005163D, 51.532268D);
map.setZoomLevel(13);

...
}
See more GeoMap methods and events in Maps API.
3.2. Layers
The component supports raster layers - XYZ tiles and WMS-services for using as a base layer and vector layers containing geographical points, polylines, and polygons. Basically, a map contains one raster layer - base layer and one or more vector layers above it. Canvas is a utility layer and belongs to a map by default.
To add a layer on a map perform its configuration in one of the following ways:
-
declare the
layerselement and its configuration in thegeoMapelement:
   <maps:geoMap id="map" height="600px" width="100%">
           <maps:layers selectedLayer="salespersonLayer">
               <maps:tile id="tiles" tileProvider="maps_OpenStreetMap"/>
               <maps:vector id="territoryLayer" dataContainer="territoryDc"/>
               <maps:vector id="salespersonLayer" dataContainer="salespersonDc" editable="true"/>
           </maps:layers>
</maps:geoMap>-
perform configuration of the layer in the screen controller:
TileLayer tileLayer = new TileLayer();
tileLayer.setUrl("https://{s}.tile.openstreetmap.org/{z}/{x}/{y}.png");
tileLayer.setAttributionString("© <a href="https://www.openstreetmap.org/copyright">OpenStreetMap</a> contributors");
map.addLayer(tileLayer);selectedLayer is a layer which the map is focused on. Selected layer fires events, reacts on user clicks and can be modified by UI interaction in case the layer is editable.
3.2.1. Raster Layers
Raster layer consists of raster images which is a grid of pixels. Raster layer is usually served as a base background layer of a map.
You can download raster images using different providers: tile servers and WMS-services.
3.2.1.1. Tile Layer
TileLayer is used to load and display tiles that are served through a web server with URL like http://…/{z}/{x}/{y}.png. For example, OpenStreetMap tiles URL-pattern is:
To add a tile layer on a map:
-
declare it in the XML descriptor:
<maps:tile id="tiles"
urlPattern="https://{s}.tile.openstreetmap.org/{z}/{x}/{y}.png"
attribution="© <a href="https://www.openstreetmap.org/copyright">OpenStreetMap</a> contributors"/>-
or perform in the screen controller using
com.haulmont.addon.maps.web.gui.components.layer.TileLayerclass:
TileLayer tileLayer = new TileLayer();
tileLayer.setUrl("https://{s}.tile.openstreetmap.org/{z}/{x}/{y}.png");
tileLayer.setAttributionString("© <a href="https://www.openstreetmap.org/copyright">OpenStreetMap</a> contributors");
map.addLayer(tileLayer);id and url parameters are required.
Note that the most tile servers require attribution, which you can set in attribution parameter.
In order not to clutter the XML descriptors with the URL and attribution strings:
1. Move tile server settings to a Spring bean implementing com.haulmont.addon.maps.web.gui.components.layer.TileProvider interface.
2. Specify a bean name in a tileProvider attribute of the tile element.
OpenStreetMap tile provider comes out of the box, so you can use it like this:
<maps:tile id="tiles"
           tileProvider="maps_OpenStreetMap"/>
3.2.1.2. WMS Layer
Various WMS services can be used as a map provider.
WMSTileLayer layer can be added one of the following ways:
-
declared in the XML descriptor:
<maps:wms id="wms"
          url="http://ows.terrestris.de/osm/service?"
          layers="OSM-WMS"
format="image/png"/>-
performed in the screen controller using
com.haulmont.addon.maps.web.gui.components.layer.WMSTileLayerclass:
WMSTileLayer wmsTileLayer = new WMSTileLayer("wms");
wmsTileLayer.setUrl("http://ows.terrestris.de/osm/service?");
wmsTileLayer.setLayers("OSM-WMS");
wmsTileLayer.setFormat("image/png");
map.addLayer(wmsTileLayer);id, url and layers are required parameters. Other parameters have default values, which can be redefined.
See more WMSTileLayer methods in Maps API.
3.2.2. Vector Layers
A vector layer is used to display geo objects on a map. Geo objects are displayed on a map as points, polylines or polygons.
3.2.2.1. Geo Objects
Geo object is an entity having a property of a geometry type. This property should have one of the geo-specific datatypes that are included in the com.haulmont.addon.maps.gis.datatypes package:
Datatype |
Java type |
GeoPoint |
com.vividsolutions.jts.geom.Point |
GeoPolyline |
com.vividsolutions.jts.geom.LineString |
GeoPolygon |
com.vividsolutions.jts.geom.Polygon |
The property must have the following annotations:
-
@Geometry- marks that the property is to be used when displaying the geo object on a map.Note: geo object must have one geometry property, otherwise an exception will be thrown when drawing the layer.
-
@MetaProperty- specifies corresponding datatype. -
@Convert- specifies a JPA converter defining how the datatype will be persisted. JPA converters for the component’s datatypes are included in the package:com.haulmont.addon.maps.gis.converters. The current version of the component includes converters that transform coordinates into the WKT format which consequently persists as a text. While loading from DB this text will be parsed back into the objects.
Here is an example of geo object Address:
@Entity
public class Address extends StandardEntity {
    ...

    @Column(name = "LOCATION")
    @Geometry
    @MetaProperty(datatype = "GeoPoint")
    @Convert(converter = CubaPointWKTConverter.class)
    protected Point location;

    ...
}
As you can see, Address is a simple entity, one of which properties (location) is of a com.vividsolutions.jts.geom.Point type.
3.2.2.2. VectorLayer Class
VectorLayer serves as a connector between data and a map. Geo objects are provided by Data Containers (or Datasources in case of using in legacy screens).
Vector layer can be:
-
declared in the XML descriptor:
<maps:vector id="orderLayer"
             dataContainer="orderDc"
editable="true"/>-
or created in the screen controller:
VectorLayer<Order> orderLayer = new VectorLayer<>("orderLayer", new ContainerVectorLayerItems<>(ordersDc));
map.addLayer(orderLayer);
Vector layer works with both InstanceContainer and CollectionContainer.
id and dataContainer (dataSource in case of using in legacy screens) are required parameters.
setStyleProvider() method sets a function that determines geometry style for a given geo object. In CUBA 7.0 screens you can perform this declaratively using the @Install annotation in the screen controller, for example:
@Install(to = "map.territoryLayer", subject = "styleProvider")
private GeometryStyle territoryLayerStyleProvider(Territory territory) {
        return new PolygonStyle()
               .setFillColor("#08a343")
               .setStrokeColor("#004912")
               .setFillOpacity(0.3)
               .setStrokeWeight(1);
    }
setSelectedGeoObject() method sets the geo object which the layer is focused on. Geo objects can be selected by user click or automatically from the associated data container. For example, if an entity is opened in an editor screen it will be implicitly selected in a corresponding vector layer.
See more VectorLayer methods in Maps API.
3.2.2.3. Clustering
For a vector layer consisting of geo points it is possible to group nearby points into clusters:
To enable clustering add cluster element inside vector in the XML-descriptor:
<maps:vector id="locations" dataContainer="locationsDc" >
  <maps:cluster/>
</maps:vector>
You can specify additional clustering options:
-
radius - maximum radius that a cluster will cover, in pixels (default: 80).
-
weightProperty - if specified, then each point of the layer will have a weight value (int) defined by weight property of a geo object. This value will be used when calculating the summed up value of the cluster (by default, the number of points is used).
-
showCoverage - show bounds of the cluster when hovering a mouse over it.
-
disableAtZoom - specifies a zoom level from which clustering will be disabled.
-
showSinglePointAsCluster - show single point as a cluster of 1 size.
3.2.3. Canvas Layer
CanvasLayer is a utility layer belonging to a map by default. This layer is used to draw and display geometries on a map. It is similar to VectorLayer since they both display vector geometries. The difference is that VectorLayer works with geo objects while CanvasLayer works just with geometries.
It makes the task of displaying some geometry on a map pretty straightforward so there is no need to store data in an entity.
To obtain the canvas layer of a map call map.getCanvas().
Note that before working with canvas you need to select it by calling map.selectCanvas() or
map.selectLayer(map.getCanvas()).
Here is an example of adding a geographical point on a canvas layer:
CanvasLayer canvasLayer = map.getCanvas();
map.selectCanvas();

Point point = address.getLocation();
canvasLayer.addPoint(point);
You can also specify it as the selected layer in the XML descriptor:
<maps:geoMap id="map" height="600px" width="100%">
        <maps:layers selectedLayer="canvas">
            <maps:tile id="tiles" tileProvider="maps_OpenStreetMap"/>
                ...
        </maps:layers>
</maps:geoMap>
Methods that add geometries on a canvas return an object that represents this geometry on the canvas: CanvasLayer.Point, CanvasLayer.Polyline or CanvasLayer.Polygon. Using this object you can define a style or popup window, subscribe to events connected with the geometry, or use this object when you want to remove the geometry from the canvas.
Here is an example:
CanvasLayer.Point location = canvasLayer.addPoint(address.getLocation());
location.setStyle(new PointStyle(
        new FontPointIcon(CubaIcon.HOME)
                .setIconPathFillColor("#ff0000")
                .setIconTextFillColor("white")
                .setIconPathStrokeColor("black")))
        .setPopupContent(address.getName())
        .setEditable(true)
        .addModifiedListener(modifiedEvent -> address.setLocation(modifiedEvent.getGeometry()));
See more CanvasLayer methods and events in Maps API.
4. Screens
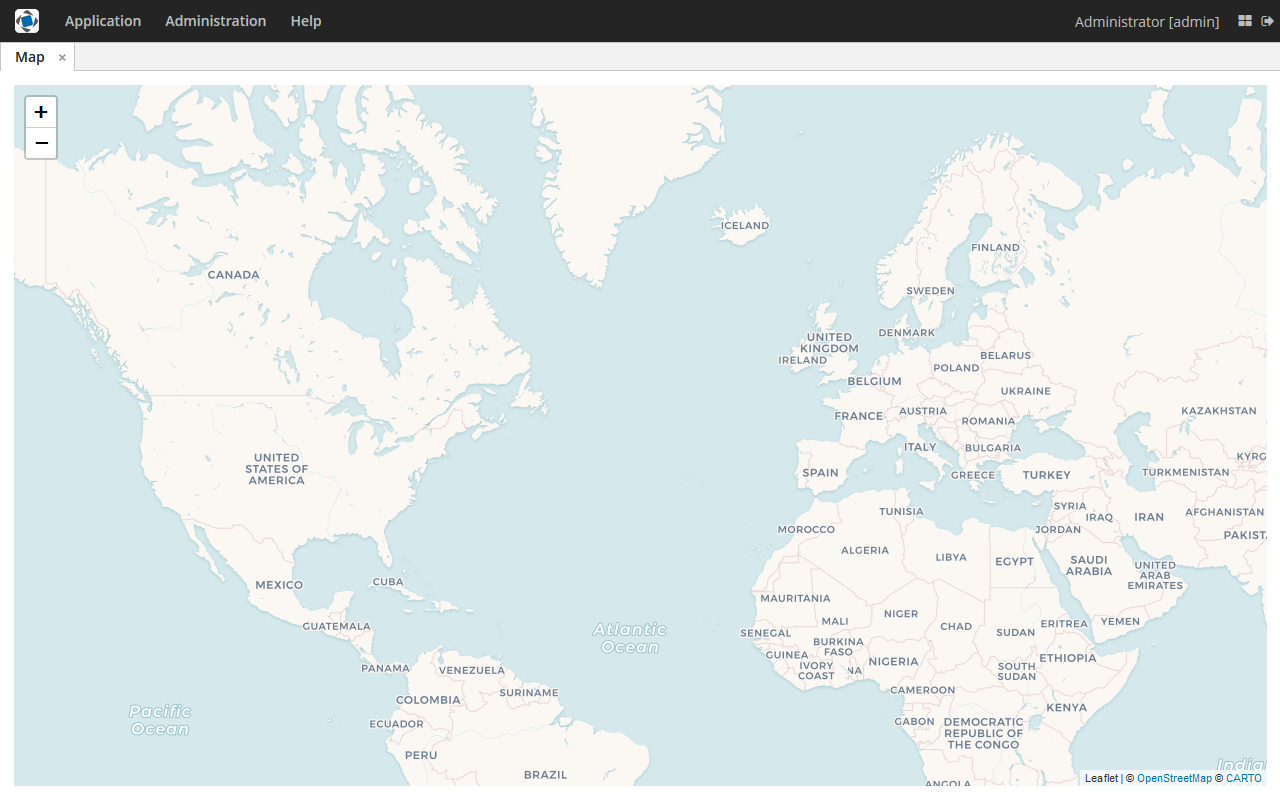
After adding a map component and a raster layer into your application you can see a map on your screens.
Here is an example of displaying a point, polyline, and polygon on a map.
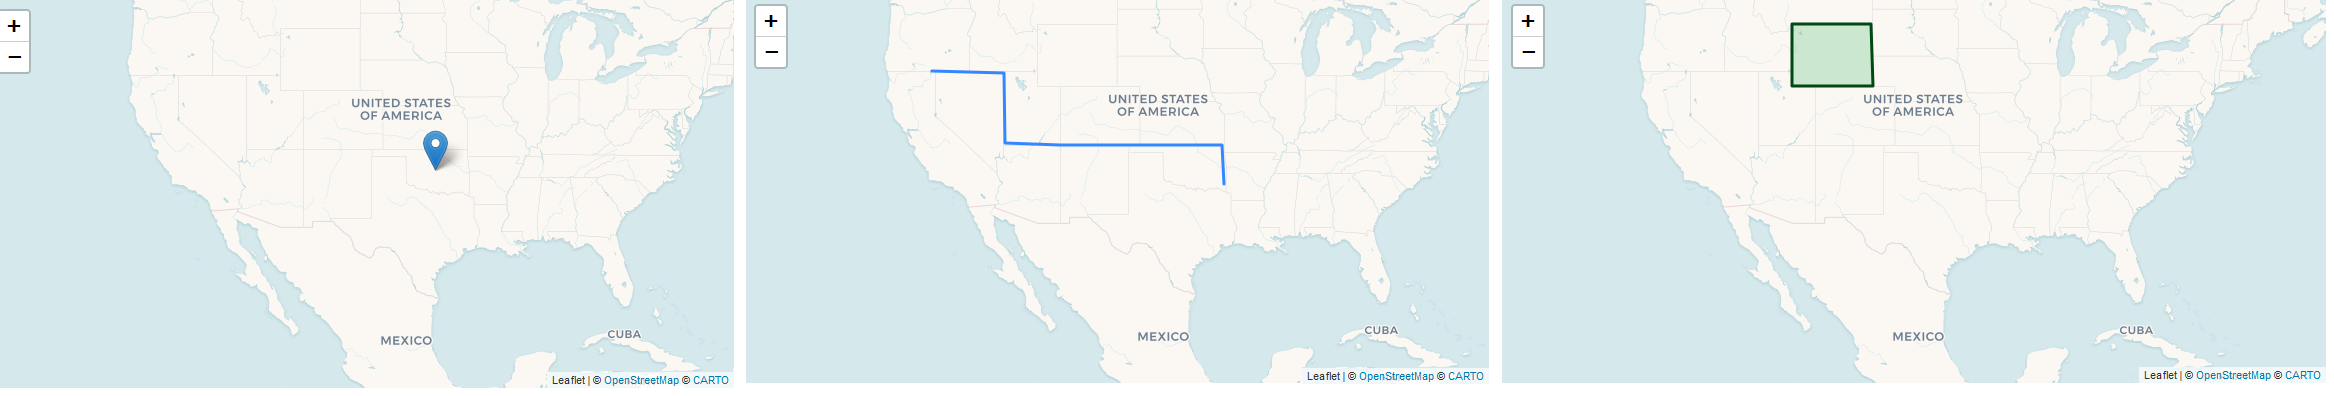
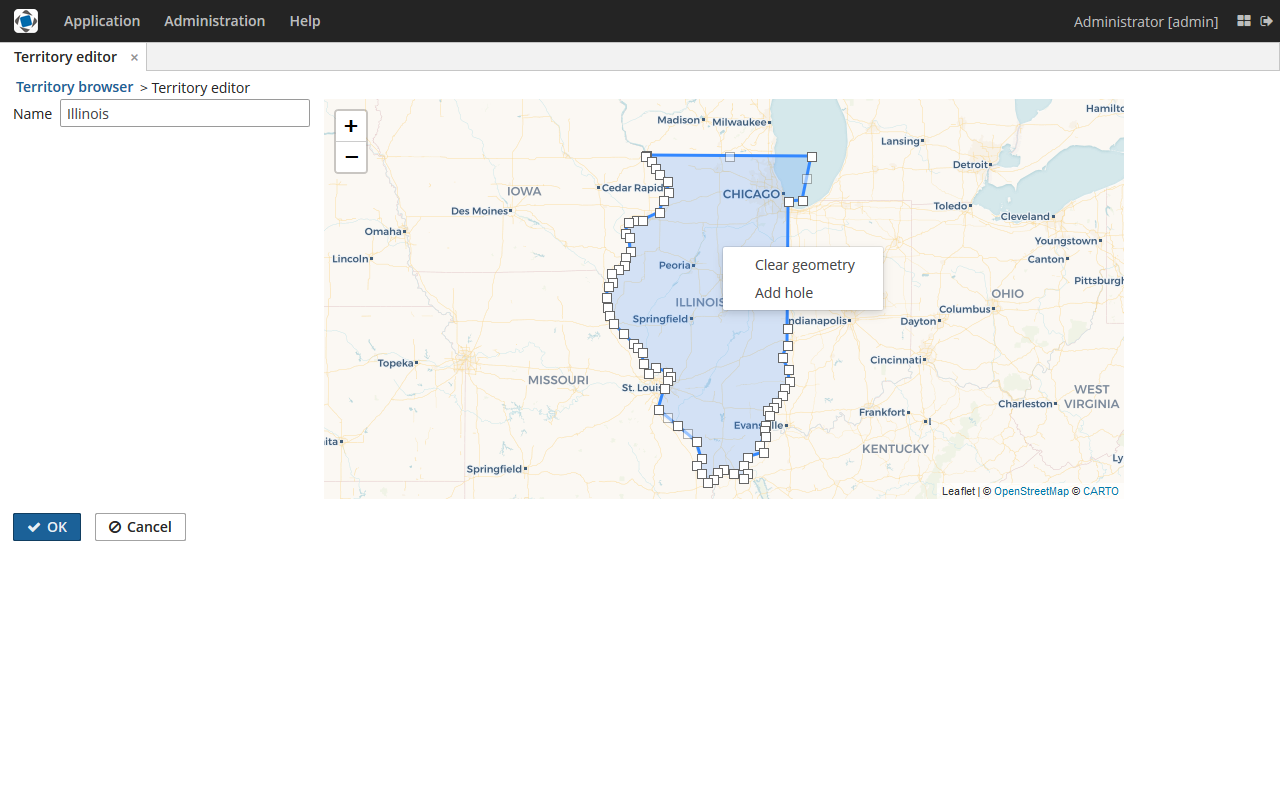
In the edit mode a polyline and polygon have points for moving and changing the shape of them. Use context menu to remove a geometry or add empty area into a polygon.
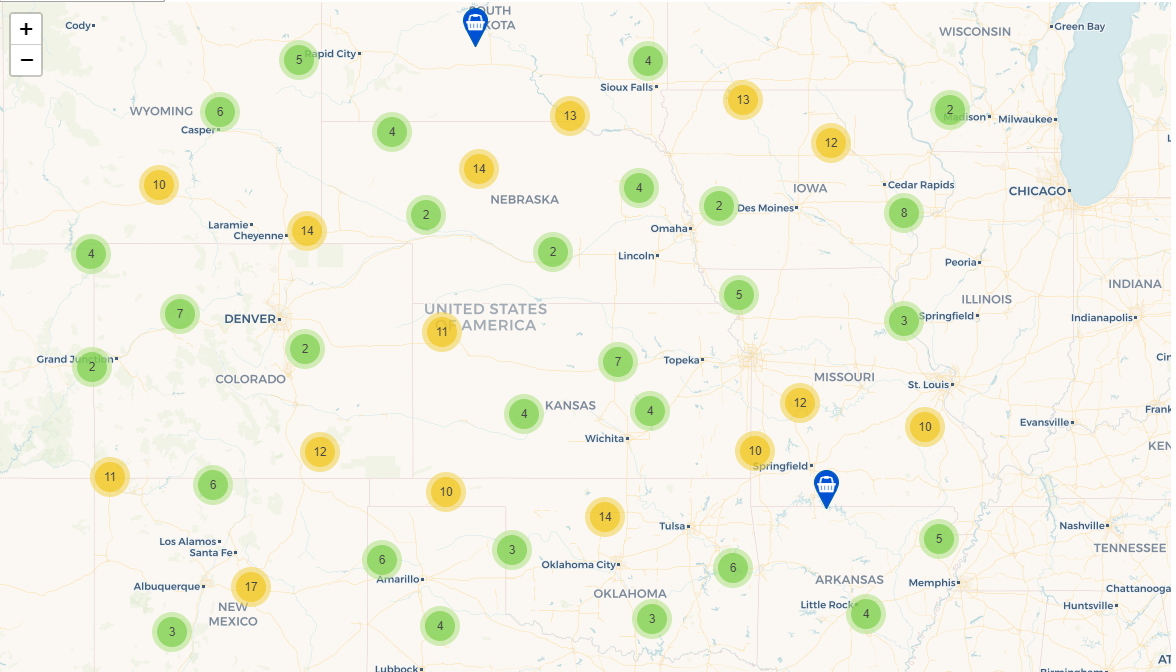
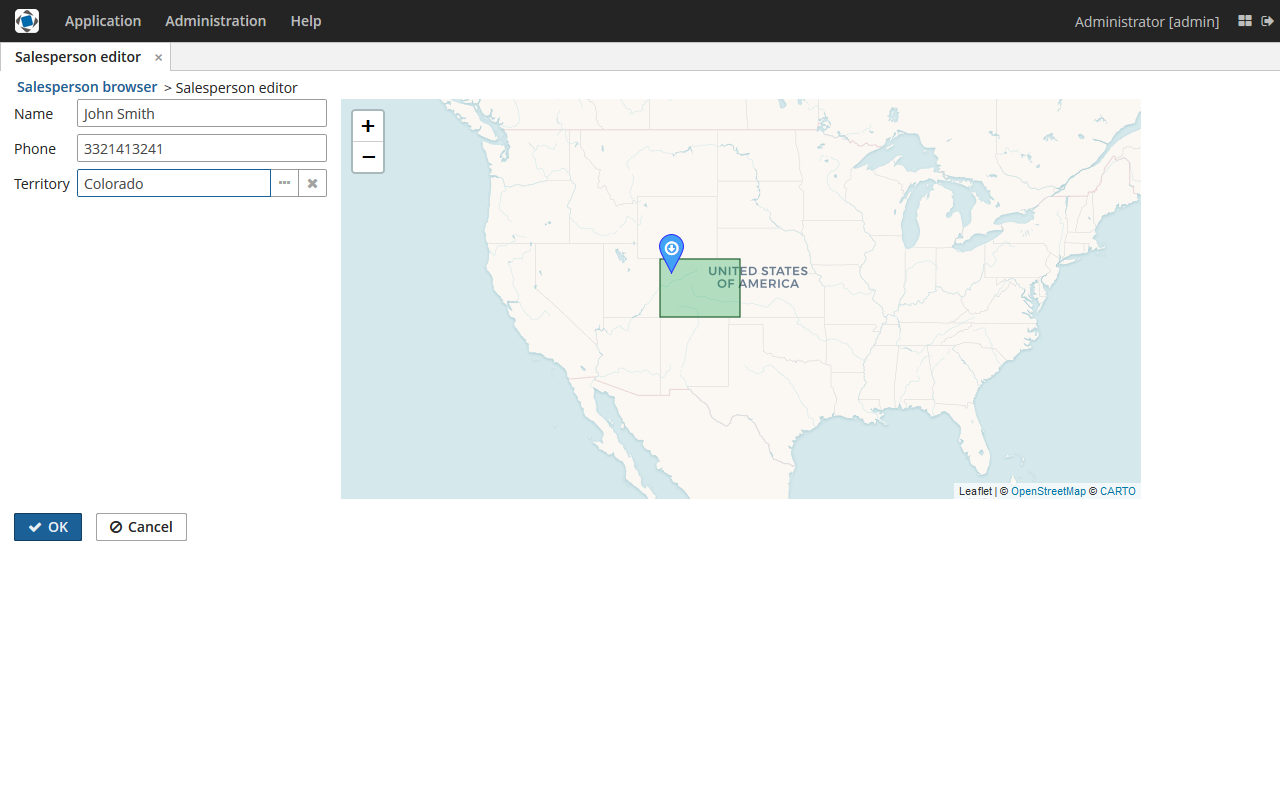
Here is an example of two vector layers working with points and polygons.
5. Maps API
5.1. GeoMap UI component
The GeoMap UI component displays a map. The map is built by superposing multiple layers.
GeoMap methods:
-
void addLayer(Layer)— adds a layer to the map. -
void removeLayer(Layer)— removes a layer from the map. -
<T extends Layer> T getLayer(String)— returns a layer by its ID. ThrowsIllegalArgumentExceptionif a layer with the given ID is not present on the map. -
<T extends Layer> T getLayerOrNull(String layerId)— returns a layer by its ID ornullif a layer with the given ID is not present on the map. -
void setCenter(double, double)— sets the initial geographic center of the map (longitude, latitude). -
void setZoomLevel(double)— sets map zoom level. -
void setMaxZoom(int)— sets maximum map zoom level. -
void setMinZoom(int)— sets minimum map zoom level. -
GeoMap.Bounds getBounds()— returns the bounds of the map which define the viewport of the map. -
void setReadOnly(boolean)— enables/disables zooming and dragging the map (changing the viewing area). -
CanvasLayer getCanvas()— returns the canvas layer of the map. -
void selectLayer(Layer layer)— sets the selected (active) layer of the map. -
void selectCanvas()— activates the canvas layer. -
Layer getSelectedLayer()— returns the selected layer of the map. -
addHeatMap(Map<Point, Double>)— adds a heatmap to the map. -
addHeatMap(Map<Point, Double>, HeatMapOptions)— adds a heatmap to the map with the additional options. -
void openPopup(PopupWindow)— opens a popup info window.
GeoMap events:
-
ClickEvent— event fired after clicking on a map. -
RightClickEvent— event fired after right click on a map. -
MoveEndEvent— event fired after changing the map’s viewing area (as a result of zooming/dragging). -
ZoomEndEvent— event fired after zooming a map. -
DragEndEvent— event fired after dragging a map. -
LayerAddedEvent— event fired after adding a layer on a map. -
LayerRemovedEvent— event fired after removing a layer from a map. -
SelectedLayerChangedEvent— event fired after changing the map’s selected layer.
5.2. Layers
TileLayer methods:
-
void setUrl(String)— sets URL-pattern of a tile server. -
void setAttributionString(String)— sets attribution string. -
void setOpacity(Double)— sets tiles opacity value in the range between 0.0 (fully transparent) to 1.0 (fully opaque).
WMSTileLayer methods:
-
void setUrl(String)— sets URL of a WMS-service. -
void setOpacity(Double)— sets tiles opacity value in the range between 0.0 (fully transparent) to 1.0 (fully opaque). -
void setCrs(CRS)— sets CRS to be used in the WMS. -
void setLayers(String)— sets WMS-service layers to display on a map (as a comma-separated list). -
void setStyles(String)— sets comma-separated list of WMS styles. -
void setFormat(String)— sets WMS image format. -
void setTransparent(boolean)— sets whether the layer is to be transparent. -
void setVersion(String)— sets WMS-service version.
VectorLayer methods:
-
void setStyleProvider(Function<? super T, GeometryStyle>)— sets a function that determines geometry style for a given geo object. In CUBA 7.0 screens you can perform this declaratively using the@Installannotation in the screen controller. -
setPopupContentProvider(Function<? super T, String>)— sets a function that determines content for bound popups which will be opened by clicking on geo objects on a map. In CUBA 7 screens you can perform this declaratively using the @Install annotation in the screen controller, for example:@Install(to = "map.territoryLayer", subject = "popupContentProvider") private String territoryLayerPopupContentProvider(Territory territory) { return territory.getName(); } -
void setPopupWindowOptions(PopupWindowOptions)— sets the explicit style parameters for geo object’s bound popups. -
void setSelectedGeoObject(T)— sets the selected geo object of the layer.
VectorLayer events:
-
GeoObjectSelectedEvent— event fired when selected geo object has changed.
CanvasLayer methods:
-
CanvasLayer.Point addPoint(com.vividsolutions.jts.geom.Point)— adds a point to the canvas. -
CanvasLayer.Polyline addPolyline(com.vividsolutions.jts.geom.LineString)— adds a polyline to the canvas. -
CanvasLayer.Polygon addPolygon(com.vividsolutions.jts.geom.Polygon)— adds a polyline to the canvas. -
void removePoint(CanvasLayer.Point)— removes a point from the canvas. -
void removePolyline(CanvasLayer.Polyline)— removes a polyline from the canvas. -
void removePolygon(CanvasLayer.Polygon)— removes a polygon from the canvas. -
void clear()— removes all geometries from the canvas. -
void drawPoint(Consumer<CanvasLayer.Point>)— activates the point drawing mode on the map. After the point is drawn, the given consumer action is applied to it. -
void drawPolyline(Consumer<CanvasLayer.Polyline>)— activates the polyline drawing mode on the map. After the polyline is drawn, the given consumer action is applied to it. -
void drawPolygon(Consumer<CanvasLayer.Polygon>)— activates the polygon drawing mode on the map. After the polygon is drawn, the given consumer action is applied to it.
addPoint method returns an instance of CanvasLayer.Point which controls the added point on the canvas.
CanvasLayer.Point methods:
-
com.vividsolutions.jts.geom.Geometry getGeometry()— returns the geometry value. -
setEditable(boolean)— sets whether the geometry is to be modifiable. -
setStyle(PointStyle)— applies a style to the point. -
setPopupContent(String)— adds a popup window to be opened as user clicks on the point. -
setPopupOptions(PopupWindowOptions)— specifies options for a popup window added by previous method.
CanvasLayer.Point events:
-
ClickEvent— event fired after clicking on the point. -
RightClickEvent— event fired after right click on the point. -
ModifiedEvent— event fired after modifying the point (as a result of drag and drop via UI).
addPolyline method returns an instance of CanvasLayer.Polyline which controls the added polyline on the canvas.
CanvasLayer.Polyline methods:
-
com.vividsolutions.jts.geom.Geometry getGeometry()— returns the geometry value. -
setEditable(boolean)— sets whether the geometry is to be modifiable. -
setStyle(PolylineStyle)— applies a style to the polyline. -
setPopupContent(String)— adds a popup window to be opened as user clicks on the polyline. -
setPopupOptions(PopupWindowOptions)— specifies options for a popup window added by previous method.
CanvasLayer.Polyline events:
-
ClickEvent— event fired after clicking on the polyline. -
RightClickEvent— event fired after right click on the polyline. -
ModifiedEvent— event fired after modifying the polyline via UI.
addPolygon method returns an instance of CanvasLayer.Polygon which controls the added polygon on the canvas.
CanvasLayer.Polygon methods:
-
com.vividsolutions.jts.geom.Geometry getGeometry()— returns the geometry value. -
setEditable(boolean)— sets whether the geometry is to be modifiable. -
setStyle(PolygonStyle)— applies a style to the polygon. -
setPopupContent(String)— adds a popup window to be opened as user clicks on the polygon. -
setPopupOptions(PopupWindowOptions)— specifies options for a popup window added by previous method.
CanvasLayer.Polygon events:
-
ClickEvent— event fired after clicking on the polygon. -
RightClickEvent— event fired after right click on the polygon. -
ModifiedEvent— event fired after modifying the polygon via UI.
You can subscribe to events fired by a particular canvas geometry or you can subscribe to events fired by all points, polylines or polygons using the CanvasLayer interface.
For more detailed information about the methods and parameters of addon’s classes, please refer to the corresponding JavaDocs.